


Get our report on investing trends!
By providing your email, you will shortly receive the latest report from Pepper.
Secondaries LP reporting has traditionally managed portfolio complexity by aggregating it away — and institutional LPs who understand what they own are beginning to ask for the underlying data that aggregation obscures.


An LP operational due diligence team is meeting with a secondaries GP at a final close. They ask: “Can you show us our top 20 underlying company exposures across your entire portfolio, right now?” The GP pauses, explains they’ll need to pull that together, and follows up with a spreadsheet two weeks later. The LP commits to the fund at a smaller allocation than originally indicated.
That conversation is occurring with increasing frequency. The LPs who ask the question already know whether the GP can answer it before they ask — because they have asked it of other secondaries managers and have seen how long it takes.
The underlying company exposure question is a proxy for a larger assessment: does this secondaries manager’s data infrastructure match the complexity of what they invest in? A secondaries portfolio with 100 underlying fund positions has indirect exposure to hundreds or thousands of underlying portfolio companies. The reporting infrastructure that serves LPs in this portfolio should reflect that complexity. The traditional approach — a fund-level summary that aggregates the complexity into portfolio-level statistics — manages the complexity by not reporting on it.
Institutional LPs who are sophisticated about secondaries portfolio management understand what this approach obscures: concentration risks that are invisible at the fund level but material at the portfolio company level; vintage attribution that would reveal whether returns are coming from the expected cohorts; GP quality stratification that would demonstrate whether the manager’s sourcing and selection process is generating returns from the right managers.
Vintage attribution. Performance disaggregated by the vintage year of each underlying fund position, not just reported at the secondaries fund level. Institutional LPs want to know whether returns are coming from the 2018 and 2019 vintages that were priced at reasonable multiples, or from the 2021 vintages that were priced at peak market multiples. Fund-level IRR does not answer this question. Vintage-attributed performance data does.
Underlying company exposure breakdown. The top 20 or 50 underlying company exposures across all fund positions — showing where the secondaries portfolio has concentrated exposure that is not visible at the fund-interest level. LPs who allocate to multiple private markets managers need this data to assess inadvertent concentration in the same underlying companies across their full private equity and private credit portfolio.
GP quality stratification. Performance attribution by the quality tier of GPs in the portfolio — upper quartile, established mid-market, emerging manager. This demonstrates that the secondaries manager’s sourcing and selection process is generating returns from higher-quality managers, that LP stake premiums are being paid only for GPs where they are justified by track record, and that the portfolio’s return profile reflects the manager’s stated approach to GP selection.
Real-time capital activity transparency. Current and accurate capital calls, distributions, and NAV changes available through an LP portal, not in a quarterly report delivered 45 days after quarter-end. Institutional LPs managing their own liquidity positions need to know about capital calls before they arrive, not 45 days after the quarter when they are documented. Real-time capital activity access requires a continuously updated portfolio data model — which is the same infrastructure requirement as continuous transparency in other strategy contexts.
“The LP asking for underlying company exposure breakdowns is not asking for a new report format. They are asking whether the data infrastructure exists to produce it. The answer — how long it takes, whether it requires manual assembly or is a platform query — reveals more about the secondaries manager’s operational maturity than the exposure data itself.”
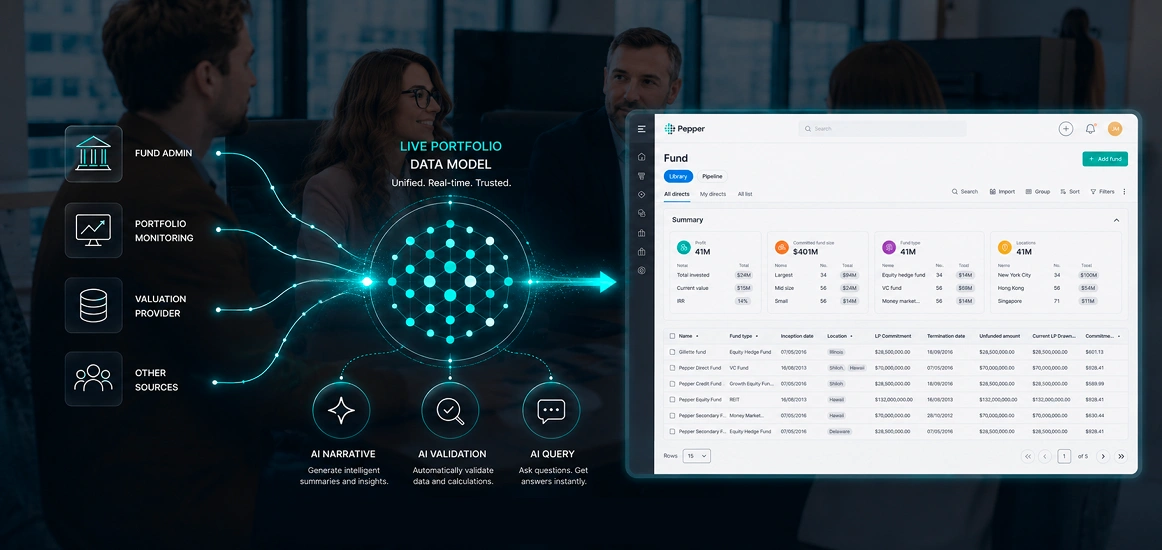
The infrastructure gap is specific: data that originates from dozens of external GP sources, in dozens of different formats, has not been normalised into a unified dataset that can answer portfolio-level queries with current, consistent data.
Vintage attribution requires linking each investment to the vintage year of the underlying fund — a data model requirement that depends on having structured fund-level metadata captured consistently for every underlying position. Underlying company exposure requires aggregating company-level data from all underlying GP reports — data that typically lives in GP systems and must be extracted through AI-powered ingestion before it can be used for portfolio-level analysis.
When an LP asks for the portfolio’s top 20 underlying company exposures, the answer requires aggregating portfolio company data from dozens of different GP reporting formats into a consistent, comparable view. Without AI ingestion and normalisation, this requires a manual exercise of contacting GPs for data, waiting for responses, and reconciling inconsistently structured responses. With AI ingestion operating on a unified data layer, it is a query against normalised data that is already current.
AI synthesis across heterogeneous GP reports is the specific capability that makes secondaries portfolio-level reporting requirements achievable at institutional scale. It is the capability that differentiates secondaries managers who have built the right data infrastructure from those who have not. And it is the capability that is most directly tested by the underlying exposure question — which is why the LPs who ask it already know the answer before the GP responds.
Pepper normalises GP-reported data across all underlying fund positions into a unified data model. Vintage attribution, underlying company exposure breakdown, GP quality stratification, and capital activity transparency are generated from that normalised data through platform queries — not assembled manually. LP portal access provides real-time data. The underlying exposure question that LPs are beginning to ask has a 30-second answer on Pepper.

Articles
August 20, 2026

Articles
August 20, 2026

Articles
August 20, 2026
Sign up for our newsletter to receive biweekly updates on the world of asset management, delivered straight to your inbox.

By providing your email, you will shortly receive the latest report from Pepper.
In a 45-minute session, we'll walk you through how Pepper handles the workflows your team runs today — deal management, portfolio monitoring, fund operations, or LP reporting. You pick the priority.
Not a sales call. A 30-minute conversation with a Pepper practitioner about where your operation is today, where the pressure points are, and whether a platform approach makes sense for your stage of growth.