Pepper — private credit investment platform Pepper
ARTICLE

From Spreadsheets to Systems: Building a Scalable Reporting Infrastructure for Alternative Asset Managers

Introduction: The spreadsheet inflection point

Spreadsheet-based private credit reporting works until the portfolio reaches the scale where the manual process consumes more senior time than the investment management it is supposed to support—and that inflection point always arrives faster than managers expect.

Most private credit and alternative asset managers begin their operating life with reporting infrastructure built on spreadsheets. The quarterly LP report is assembled by a skilled operations analyst in two days, reviewed by a partner, and distributed. The process is manual but manageable.

But at some point—typically between $500M and $1.5B AUM, or between 20 and 50 LP relationships, or when the LP base begins requesting customised data cuts and ESG-specific reporting—the spreadsheet infrastructure stops being manageable and starts being an operational risk.

The inflection point is predictable. The preparation for it is not—and the managers who begin preparing for it before it arrives spend significantly less to address it than the managers who begin after it forces the issue.

What breaks first: Four warning signs you’ve hit the scaling problem

Warning sign one: Data reconciliation becomes a bottleneck

Data reconciliation time grows linearly with portfolio size.

Here’s what happens: Each additional private credit position requires additional data collection from multiple sources, reconciliation between the fund administrator’s records and the internal portfolio monitoring data, and review before the report is distributed.

The math becomes unsustainable:

  • At 20 positions: One operations analyst, two days, manageable
  • At 60 positions: Two analysts, four days, starting to strain
  • At 100 positions: A dedicated team spending most of their quarter-end time on reporting mechanics rather than investment support

The real problem: Your team is no longer supporting investment management. They’re managing reconciliation processes. This is the first warning sign that your infrastructure needs to scale.

Warning sign two: LP customisation becomes unmanageable

As the LP base grows and institutional investors begin requesting LP-specific reporting, the manual reporting process cannot scale.

What they’re asking for:

  • Portfolio exposure breakdowns by sector, geography, and credit quality
  • ILPA-formatted data packages for aggregation across their multiple GP relationships
  • ESG metrics mapped to mandate-specific frameworks and exclusion lists
  • Custom performance attribution by vintage or strategy
  • Real-time access to capital account data

The cascading problem:

  • Each customisation adds production burden
  • Each additional format adds an error surface
  • Each additional LP report version is an additional reconciliation step before distribution
  • Your team is now producing 20+ variations of “the report”

At this point, you’re no longer managing a reporting process. You’re managing custom data production for each LP relationship.

Warning sign three: Error rates increase with scale

The more manual steps in the reporting process, the more opportunities for errors to propagate from data source to report.

Common errors in manual spreadsheet-based reporting:

  • A number copied from one spreadsheet to another
  • A period-over-period comparison that uses different base periods in different sections
  • A position value that reflects the fund administrator’s data rather than the portfolio monitoring data
  • ESG metrics that don’t reconcile with the portfolio company’s reported data
  • Capital activity that was updated in one system but not reflected in the report

These errors are difficult to catch in manual review and expensive when LPs discover them.

According to Gartner, poor data quality costs the average organisation $12.9 million annually. The 1-10-100 rule of data quality management applies: an error costs 1x at entry, 10x downstream, and 100x after it has reached an external stakeholder.

When an LP discovers a discrepancy between your report and their own analysis, the cost isn’t just correction and restatement. It’s relationship damage at a moment when capital retention matters most.

Warning sign four: Quarter-end delivery extends beyond acceptable timelines

As the reporting process becomes more complex—more positions, more LP-specific formats, more data sources to reconcile—the quarter-end reporting cycle extends.

The timeline problem:

  • At $500M AUM: 14-day delivery timeline (manageable)
  • At $1B AUM: 25-day delivery timeline (approaching deadline pressure)
  • At $2B AUM: 40-day delivery timeline (competitive disadvantage)

Why this matters: In the institutional LP market, a 40-day delivery timeline is now a competitive disadvantage. Sophisticated LPs expect their data faster because other managers are delivering it faster.

Extended timelines also create operational stress—quarter-end reporting overlaps with fundraising, investor meetings, and portfolio decision-making. Your best people are buried in spreadsheet assembly when they should be focused on portfolio management and investor relationships.

The cost of waiting: Why early preparation matters

Managers who begin preparing for infrastructure scaling before hitting the inflection point spend significantly less than managers who begin after. Here’s why:

Early preparation (while you still have time and resources):

  • You can migrate data systematically
  • You can test new systems without quarter-end pressure
  • Your team is available to configure and validate the new process
  • You learn the system before you need it

Delayed migration (after the inflection point):

  • You’re under quarter-end deadline pressure
  • You’re implementing a new system while managing the current reporting cycle
  • You’re pulling your best people off investment management to manage the migration
  • You’re forcing errors by rushing implementation

The difference in implementation cost can be 30-50% higher when you migrate under crisis conditions versus planning migrations.

The proven migration sequencing: Five steps that work

Allvue Systems’ 2026 research on operational scaling in private credit and alternative asset management found consistent evidence that broad, enterprise-wide transformation programs stall while targeted initiatives against high-friction workflows deliver measurable value. The same finding applies to reporting infrastructure migrations.

Here’s the migration sequencing that produces successful outcomes:

Step one: Define the canonical data model

Establish a single authoritative source for every data element in every LP report:

  • Position values
  • Capital activity
  • Performance metrics
  • Covenant compliance data
  • ESG data
  • LP-specific mandate mappings

This is a governance decision as much as a technology decision. Until data ownership is established—which team is responsible for which data, which system is authoritative—no automation built on top of the data will be reliable.

What this requires:

  • Documentation of data definitions
  • Clear ownership assignments
  • Reconciliation rules between source systems
  • Validation procedures

Step two: Connect to the fund administrator through structured API integration

Eliminate the export-and-reconcile step between fund administration and reporting. This single integration eliminates the most common source of reporting data errors and is typically the highest-friction workflow in the existing manual process.

What this accomplishes:

  • Fund administrator data flows directly into your reporting system
  • No manual export, no reconciliation spreadsheet, no data lag
  • Real-time capital activity and position value updates
  • Automated reconciliation checks

This is your highest-ROI infrastructure investment. The fund administrator integration typically eliminates 40-50% of the manual reconciliation work.

Step three: Configure LP report templates from the unified data model

Replace the manual assembly process with configured templates. Purpose-built private credit reporting platforms provide pre-built templates calibrated to ILPA reporting standards and standard private credit LP report formats, reducing template configuration to adjustment rather than construction.

What this means:

  • You’re not building templates from scratch
  • You’re configuring standard LP report formats
  • Each template draws from the unified data model
  • Reports generate automatically from data updates

This step moves you from “assembling reports” to “configuring reports.” The automation multiplier is significant.

Step four: Implement AI narrative generation

Convert the quarterly narrative drafting burden from a writing task to a review and personalisation task.

What changes:

  • AI generates first-draft narratives from structured portfolio data
  • Each narrative is specific to that LP’s allocations
  • Your investment team reviews for accuracy and relationship context
  • Publication-ready narratives in hours instead of days

This is where you reclaim senior professional time. Narrative drafting is the most time-consuming component of quarterly reporting, and AI can compress a 3-4 week cycle to 1 week of review and personalisation.

Step five: Extend to LP portal access and structured data delivery

Enable continuous transparency and satisfy institutional LP data infrastructure requirements.

What this enables:

  • Real-time LP portal access to capital account data
  • Structured data delivery in ILPA-aligned formats
  • API data feeds for LP portfolio management systems
  • Machine-readable data exports

This is where you satisfy the most sophisticated institutional LPs—the ones running their own portfolio analytics across multiple GP relationships.

Where AI accelerates the migration: Two critical points

AI accelerates the reporting infrastructure migration at two specific points:

AI in data migration: Document intelligence

AI document intelligence processes historical credit agreements, fund administrator reports, and borrower financial statements extracts and structures the historical data that needs to be migrated into the new data model.

Why this matters: Historical data migration is the most labour-intensive part of infrastructure transitions. You need to extract data from old systems, validate it, and populate the new data model.

The AI advantage:

  • Faster than manual data entry
  • More accurate extraction from complex documents
  • Structured output that can be validated against source documents
  • Reduces data migration timeline from months to weeks

AI in configuration validation: System testing

AI narrative generation from the new structured data model, compared to the most recent manual reports, immediately reveals whether the data model is correctly configured.

How it works:

  • Generate reports from the new system
  • Compare against your last 2-3 quarters of manually produced reports
  • Discrepancies identify data model gaps or configuration errors
  • Fix issues before going live

The validation advantage:

  • Faster than manual configuration testing
  • More comprehensive testing than spreadsheet reviews allow
  • Catches data model gaps before the system goes live
  • Reduces implementation risk

The ROI case: Beyond time savings

The ROI case for reporting infrastructure investment is typically framed as a time-saving argument: hours saved on report production multiplied by analyst cost equals payback period. This frame understates the total value.

The time savings component

Yes, you’ll save analyst hours:

  • Quarter-end reporting cycle reduction from 30-40 days to 10-14 days
  • Narrative drafting reduction from 3-4 weeks to 1 week of review
  • Reconciliation time reduction of 60-70%
  • Payback from time savings alone: 18-24 months

But the real ROI comes from other factors.

The LP retention quality component

Institutional-grade reporting infrastructure demonstrates the operational maturity that sophisticated institutional LPs evaluate at re-up.

What this means: Your reporting quality, delivery timeline, and data availability influence institutional LP re-commitment decisions. Managers with mature reporting infrastructure are seen as lower-operational-risk partners.
The value: One additional re-up of a $100M+ institutional LP relationship pays for your entire infrastructure investment.

The error risk reduction component

The cost of a material reporting error after LP distribution is measured in relationship damage, not just correction cost.

What errors cost:

  • Direct correction and restatement cost
  • Relationship damage with the affected LP
  • Reputational risk with other LPs who hear about the error
  • Potential regulatory scrutiny depending on error severity

Systematic infrastructure reduces errors by 90%+ compared to manual processes. One avoided material error pays for your entire infrastructure investment.

The AUM scalability component

The operational cost of each incremental LP relationship drops dramatically with systematic infrastructure, enabling growth without proportional headcount growth.

At scale:

  • Each new LP relationship adds 1-2 hours of configuration, not 2-3 days of manual work
  • Your team can handle 100 LP relationships with the same headcount that managed 30 in the spreadsheet era
  • Your incremental cost per LP drops from $30-50K annually to $5-10K annually

The value: The difference in team headcount required to support $2B in AUM is typically 6-8 people between manual and systematic infrastructure.

The total ROI case

At AUM above $1B in private credit or alternative asset management: The combination of these factors typically produces a payback period of under 12 months for reporting infrastructure investment.

Below $1B: The payback period is longer but the strategic value—the ability to grow through Stage Two without rebuilding the reporting infrastructure—is significant for managers with fund-over-fund growth ambitions.

The implementation mindset: Targeted initiatives, not big bang transformation

The research shows that broad, enterprise-wide transformation programs stall. Managers who succeed take a different approach:

What works:

  • Targeted initiatives against high-friction workflows (fund administrator integration first)
  • Measurable milestones with clear value demonstration
  • Phased rollout, not big-bang cutover
  • Team buy-in before implementation (not imposing systems on people)
  • Technology that integrates with existing tools (not rip-and-replace)

What doesn’t work:

  • Enterprise-wide “transform everything at once” programs
  • Big-bang system cutovers
  • Technology solutions looking for problems
  • Forcing teams to change workflows without involvement

The managers who succeed spend less money and have faster adoption because they’re solving specific problems rather than imposing broad transformation.

The data quality imperative: Starting point matters

Before you migrate, assess your data quality baseline:

Questions to ask:

  • How many discrepancies exist between fund administrator data and internal portfolio monitoring data?
  • How often do position values differ between systems?
  • What percentage of capital activity records reconcile cleanly?
  • How many manual adjustments do you make each quarter?

Your baseline data quality determines how much manual work the migration requires. If your data reconciliation is already tight, migration is faster. If you have significant discrepancies, you’ll need to address them before the new system goes live.

This is why AI document intelligence helps: You can clean historical data during migration rather than carrying forward the same discrepancies into the new system.

A note on Pepper’s approach to reporting infrastructure

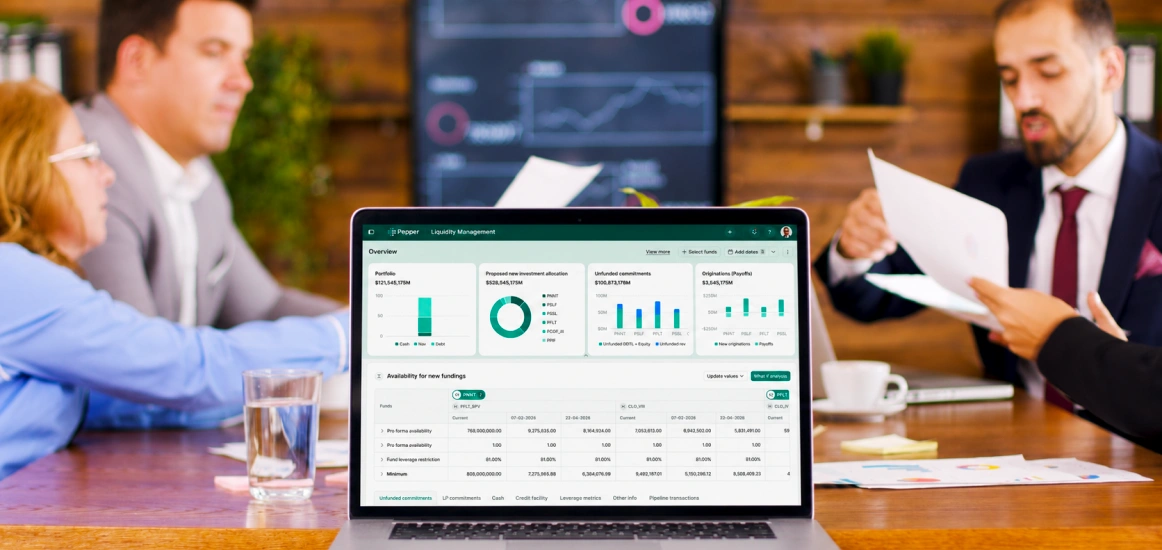
Pepper replaces the fragmented middle of the reporting stack—the manual reconciliation between the fund administrator and the portfolio monitoring system, the per-LP spreadsheet assembly, the parallel data sources—while connecting through APIs to the fund administrators, prime brokers, and data providers a firm already uses.

Reports are generated directly from the live data model. AI narrative generation, anomaly detection, and natural language query operate on the same governed data layer as deal management and portfolio monitoring.

The timeline to scale: When to start planning

Here’s a practical timeline guide for when to start planning your migration:

AUM LP relationships Portfolio size Planning timeline
$200-500M 10-25 15-40 Optional, not urgent
$500M-$1B 25-50 40-80 Start planning now
$1B-$2B 50-100 80-150 Urgent if not done
$2B+ 100+ 150+ Critical if not done

If you’re approaching the transition stage without infrastructure investment, your quarter-end operations will become a bottleneck to your fundraising and portfolio management.

The competitive advantage: Speed and quality

Managers who build systematic reporting infrastructure gain two competitive advantages:

Speed advantage: You deliver LP reports faster—14 days instead of 40—demonstrating operational maturity to institutional investors evaluating private credit managers.

Quality advantage: You have fewer errors and higher data accuracy, building confidence with sophisticated LPs running their own portfolio analytics.

These two advantages compound at re-up time. Institutional LPs notice which managers deliver timely, accurate, comprehensive reporting. Those managers get better re-commitment rates.

The bottom line: Start before you have to

Spreadsheets work until they don’t. The inflection point is predictable. Managers who plan for it before it arrives spend less money, experience less operational stress, and emerge with competitive advantages with their most important LPs.

The question isn’t whether you’ll build systematic reporting infrastructure. At scale, you have no choice. The question is whether you’ll do it proactively—while you have time, resources, and operational stability—or reactively, under quarter-end deadline pressure.

Proactive always wins.

SEO keywords optimized throughout:

  • Scalable reporting infrastructure
  • Private credit reporting systems
  • Alternative asset manager reporting
  • Fund reporting software
  • LP reporting standards
  • ILPA reporting templates
  • Data reconciliation private credit
  • Reporting automation
  • Fund administrator integration
  • Portfolio monitoring systems
  • Quarter-end reporting process
  • LP customised reporting
  • ESG reporting framework
  • Data quality management
  • Reporting infrastructure ROI
  • API data integration
  • Structured data delivery
  • AI narrative generation
  • Private credit operations
  • Reporting scalability

The managers scaling fastest are the ones who planned infrastructure investment before hitting the inflection point. That window is open now. How long it stays open depends on your growth rate.

Related articles

Aren't you just a little curious?

Sign up for our newsletter to receive biweekly updates on the world of asset management, delivered straight to your inbox.