




AI Insights
July 28, 2026


Every Report Traces Back to One Source of Data
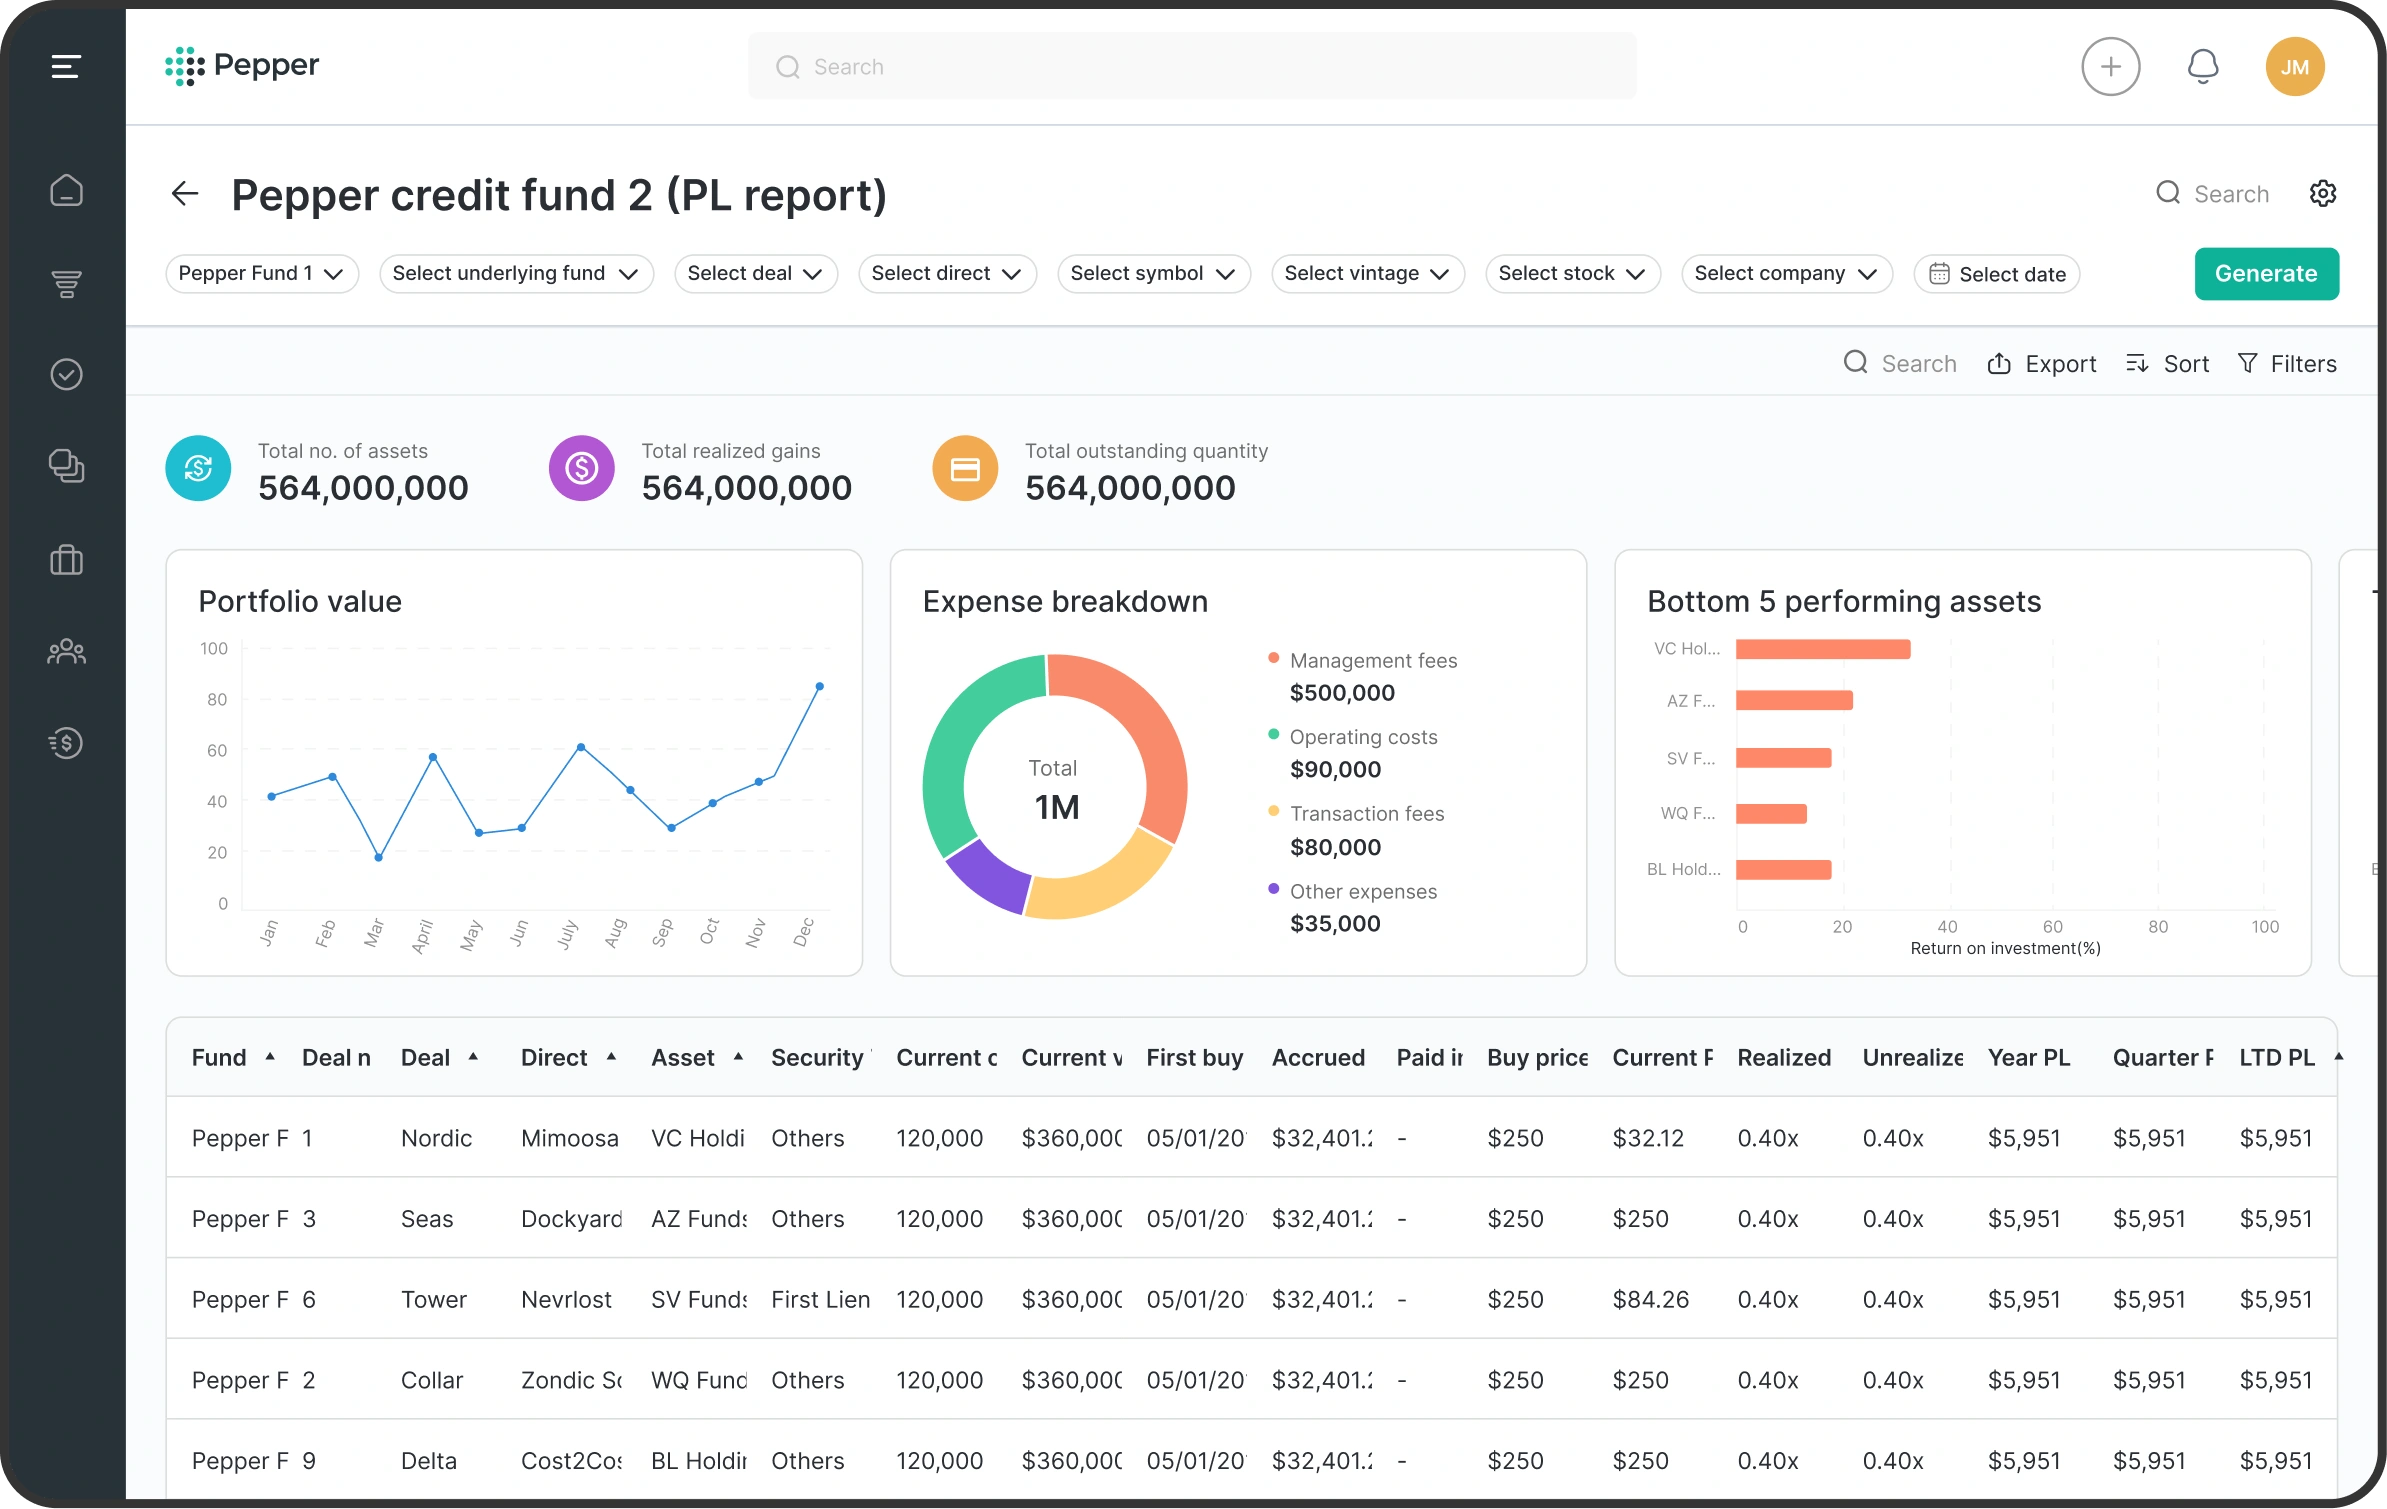
Pepper tracks all investments across Investment, Fund, Portfolio, and Asset levels — with seamless drill-down into any position and roll-up using any hierarchy. No manual aggregation.
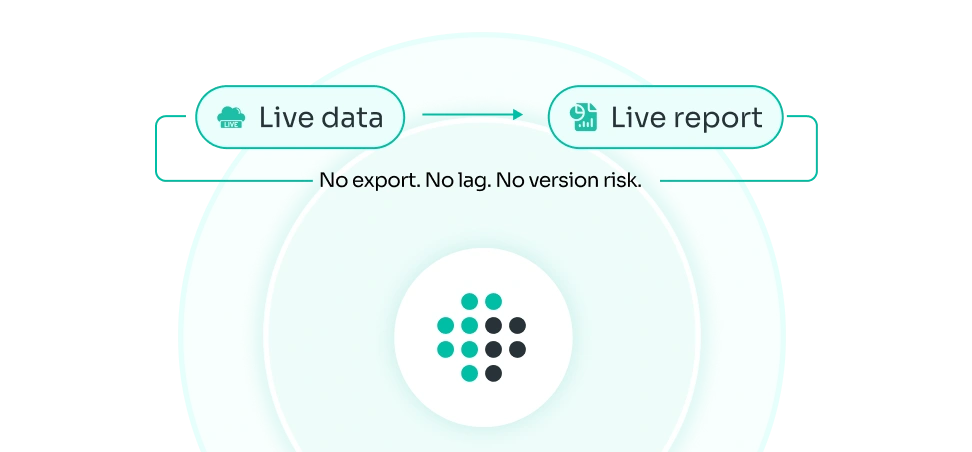

Every platform that requires data to be exported before it can be reported creates a gap — between what the system knows and what your LP receives. When that data changes, the export doesn't. Pepper's reports draw from the live record. When the data changes, the report reflects it.
What Pepper's Reporting and Analytics Module Covers

Real-time visibility into deal flow by stage, strategy, vintage, and manager — so your investment committee sees the same pipeline your deal team is working from.

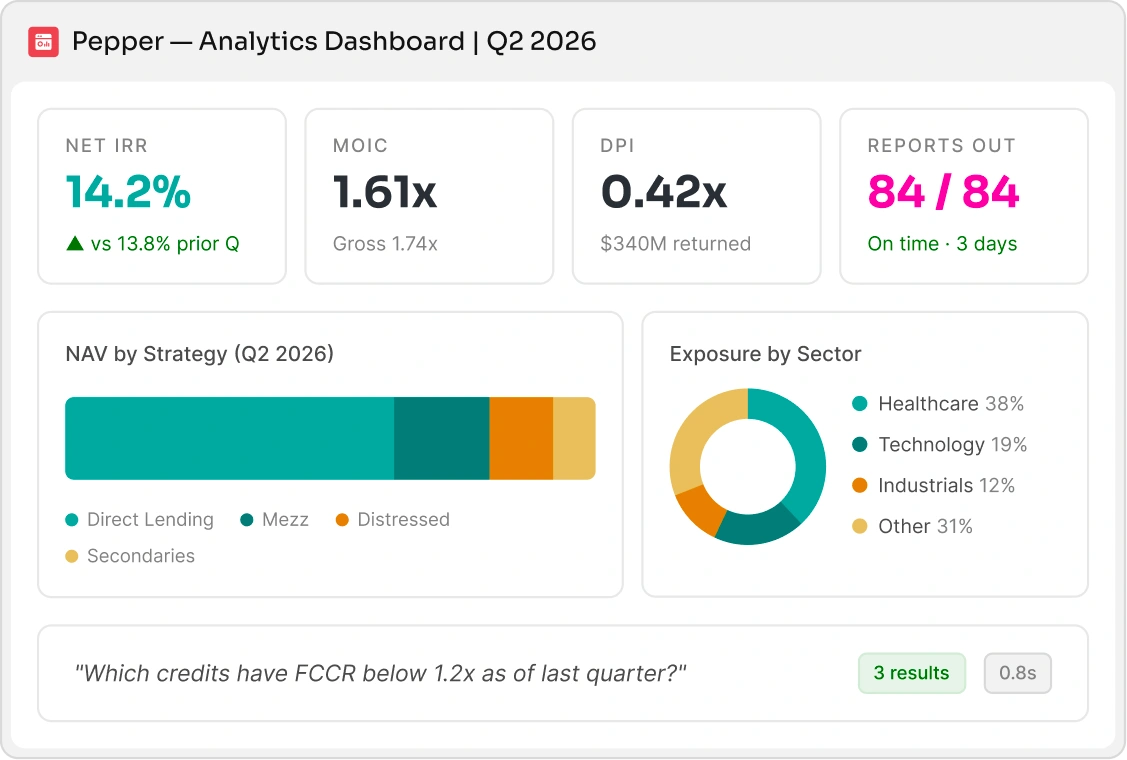
IRR, MOIC, DPI, TVPI, and RVPI calculated from live position data across your full portfolio — by fund, vintage, strategy, manager, or custom grouping. No separate calculation model.

Single-fund and multi-fund position views, with roll-up across fund structures, vehicles, and strategies — all drawing from the same underlying asset library.

Counterparty concentration, asset type allocation, position size distribution, currency exposure, and sector heat maps — generated from live data, not a monthly extract.

Build the analytics views and report templates your investment team and LPs actually need — without professional services engagements or long development queues.

Generate regulatory filings and compliance reports directly from portfolio data — with full audit trail, version history, and sign-off workflow built in.

Track investment restriction compliance and concentration limits continuously against each fund's governing documents not just at quarter-end.

Pepper AI operates on the same structured portfolio data that powers every report — making its outputs verifiable and grounded in the same source your LPs receive.

First-draft LP report narratives assembled from structured portfolio data each quarter. Your team reviews, edits, and approves. Quarter-end reporting goes out faster — and the narrative is grounded in the data your platform holds, not reconstructed from memory and exports.
Time saved: Days off the quarter-end reporting cycle

Pepper AI flags statistical anomalies in reported figures before they reach investors — catches input errors, outlier valuations, and inconsistencies between current and prior period data automatically.
Use case: QA sweep before LP distribution catches what manual review misses

Ask your portfolio data questions in plain English. 'Which credits have FCCR below 1.2x as of last quarter?' returns a filtered table in seconds — no analyst intermediary, no report request queue.
Time saved: Instant data retrieval vs hours of analyst lookup
AI Insights
July 28, 2026
See how private credit managers use Pepper to calculate NAV from the
same data that
governs each credit agreement — not reconstructed
from it.
Biweekly insights on market trends, operational best practices, and platform intelligence - delivered to your inbox

By providing your email, you will shortly receive the latest report from Pepper.
In a 45-minute session, we'll walk you through how Pepper handles the workflows your team runs today — deal management, portfolio monitoring, fund operations, or LP reporting. You pick the priority.
Not a sales call. A 30-minute conversation with a Pepper practitioner about where your operation is today, where the pressure points are, and whether a platform approach makes sense for your stage of growth.