


Get our report on investing trends!
By providing your email, you will shortly receive the latest report from Pepper.
An industry perspective for operations, technology, and investment leaders



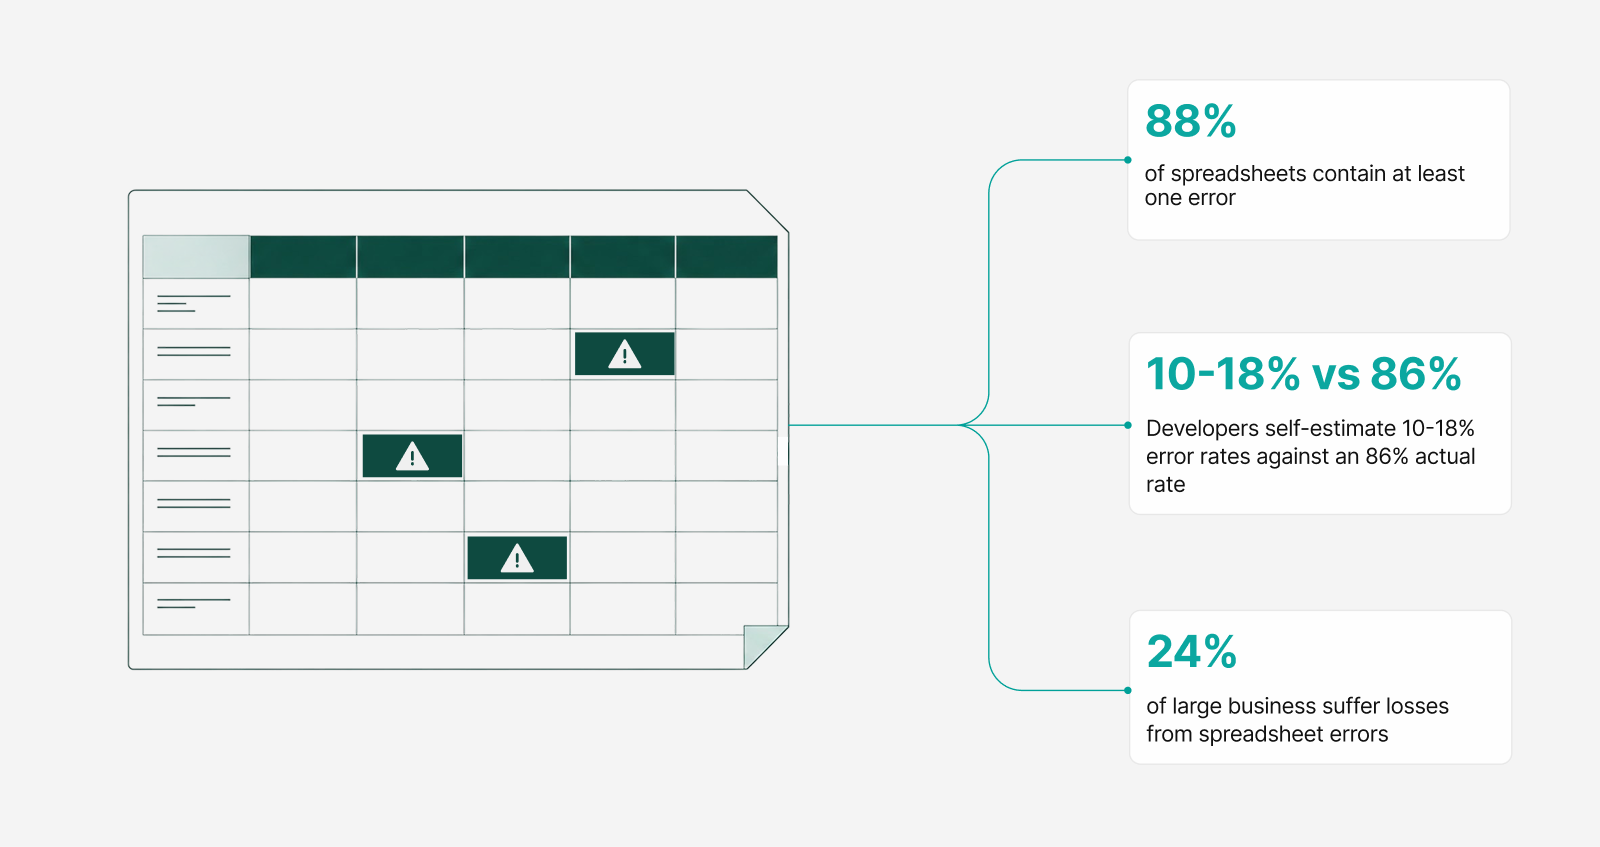
Despite a decade of platform investment, the operational core of most credit managers is still a spreadsheet. Excel remains the system of record for portfolios, valuations, covenant tracking, and investor reporting at a remarkable share of firms — not because teams trust it, but because nothing else has matched its flexibility in modeling the bespoke, fast-changing instruments these strategies generate. The cost of that reliance is documented and severe. Decades of research summarized by Professor Raymond Panko find that roughly 88% of spreadsheets contain at least one error, and field audits put the figure higher still. The consequences are not hypothetical: a spreadsheet error cost JPMorgan $6.2 billion in the 2012 “London Whale” episode, a missing minus sign cost Fidelity $2.6 billion, and a spreadsheet mistake drove Fannie Mae’s $1.13 billion accounting restatement.
This problem is becoming structurally worse, because credit managers are no longer running one strategy. The same firm that built a direct lending book is now also running asset-based finance (ABF) and, increasingly, private equity sleeves under one roof. ABF alone has grown to roughly $6.1 trillion and is projected to exceed $9 trillion by 2029 — larger than the syndicated loan, high-yield, and direct lending markets combined — and the largest managers are all building multi-strategy platforms to capture it. Each of these strategies has a fundamentally different data shape. A spreadsheet built for one cannot represent the others, so multi-strategy firms accumulate parallel spreadsheet estates that never reconcile.
The technical question this paper addresses is precise: what does it actually take to build a single, unified data model that can represent direct lending, ABF, and private equity in one coherent structure — without flattening the differences that make each strategy distinct? The answer is not a bigger spreadsheet or a single screen. It is a canonical data model built on a shared spine of common entities — legal entity, instrument, position, cash flow, valuation, and time — extended with strategy-specific detail through a disciplined supertype-subtype design. This paper sets out that architecture, the modeling principles behind it, and the capabilities it unlocks.
Excel persists in credit not because managers trust it, but because it is the only tool flexible enough to model bespoke instruments — and that same flexibility is exactly why it cannot scale across strategies or be trusted at audit. A unified data model solves both problems at once: it imposes structure where Excel imposes none, and it represents direct lending, ABF, and private equity through one canonical core with strategy-specific extensions. The unit of design is not the report or the screen; it is the data model itself. Get the model right and every downstream capability — cross-strategy reporting, look-through risk, AI — follows. Get it wrong and no amount of tooling on top will compensate.
Excel earned its place. It is the most flexible data tool ever built for finance: a blank grid that imposes no schema, accepts any structure, and lets an analyst model a bespoke unitranche with a custom PIK toggle in an afternoon. For instruments that are negotiated one at a time and amended unpredictably, that flexibility is genuinely valuable — which is why, by various estimates, Excel sits on roughly 90% of finance desktops and remains the system of record for critical processes at a large share of credit managers.
But the property that makes Excel flexible — the absence of any enforced structure — is the same property that makes it unreliable at scale. There is no schema to validate against, no referential integrity, no separation between data and logic, and no audit trail of who changed what and when. The research on this is unusually consistent and unusually old, which is itself the point: the risk has been known for thirty years and remains unaddressed.
| Spreadsheet-risk finding | Figure |
|---|---|
| Spreadsheets containing at least one error | ~88% (field audits higher) |
| Large businesses suffering losses from spreadsheet errors | 24% |
| Developers’ self-estimated error rate vs. actual | ~10–18% believed / ~86% actual |
| JPMorgan “London Whale” loss (Excel hazard-rate error) | $6.2 billion |
| Fidelity distribution error (missing minus sign) | $2.6 billion |
| Fannie Mae accounting restatement (spreadsheet error) | $1.13 billion |
The deeper problem is structural rather than clerical. A spreadsheet conflates three things a real data system keeps separate: the data, the logic that operates on it, and the presentation of the result. When all three live in the same grid, every copy-paste propagates logic along with data, every new period spawns a new file, and the authoritative version of any number becomes a matter of folklore. A single analyst holds the model in their head; when they leave, the institutional knowledge leaves with them. None of this is a failure of discipline. It is the inevitable consequence of using a tool with no concept of a schema to do a job that requires one.
For most of the last decade, a credit manager could survive on spreadsheets because it ran essentially one strategy. That assumption no longer holds. The defining structural shift in private markets is the convergence of strategies under single platforms — and it is precisely this convergence that makes the spreadsheet model untenable.
The clearest driver is the explosive growth of asset-based finance. According to KKR, the private ABF market has roughly doubled since the financial crisis to more than $6.1 trillion and is projected to exceed $9 trillion by 2029 — a market larger than the syndicated loan, high-yield bond, and direct lending markets combined. Private credit funds today supply less than 5% of that financing, leaving an enormous runway. The largest managers have responded by building dedicated ABF capability alongside their direct lending and private equity businesses: KKR, Apollo, Carlyle, Blackstone, and Sixth Street have all launched or scaled ABF strategies, frequently through multi-billion-dollar portfolio acquisitions from retreating banks.
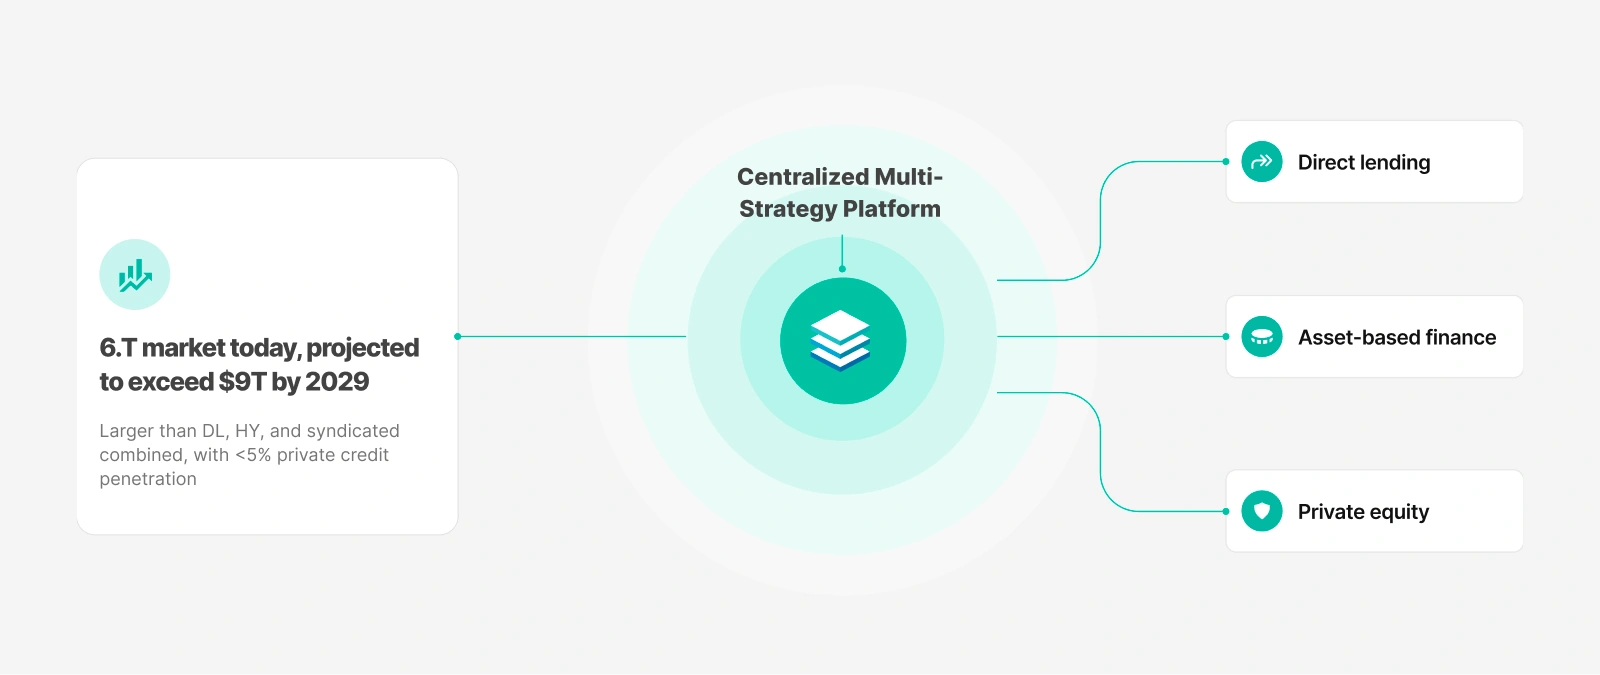
The result is that the modern credit platform is multi-strategy by default. A single firm now routinely runs corporate direct lending, asset-based finance, and private equity or equity co-investment sleeves — three businesses with three fundamentally different data shapes, sharing capital, LPs, and increasingly the same borrowers viewed from different angles.
A spreadsheet is built for a specific instrument shape. The direct lending model assumes one borrower, one facility, a covenant package, and an amortization schedule. It cannot represent a pool of fifty thousand auto loans with a borrowing base and advance rates, nor a cap table with ownership percentages and a J-curve. So each strategy gets its own spreadsheet estate, built by a different team on different assumptions, and the firm-level view — total exposure to a borrower that appears as a corporate loan in one book and as pledged collateral in another — becomes impossible to assemble. The First Brands bankruptcy of 2025, in which the same receivables were reportedly pledged to multiple lenders, is the cautionary archetype: fragmented data across strategies hides concentration that a unified model would surface immediately.
Private asset based finance market today
Projected ABF market by 2029
(>DL+HY+syndicated combined)
Share of ABF currently financed by private credit funds
Building one data model across direct lending, ABF, and private equity is hard for a specific, identifiable reason: the three strategies disagree about the most basic question a data model must answer — what is the atomic unit being tracked? Until that disagreement is resolved, no unified model is possible. The table below makes the divergence explicit.
| Dimension | Direct lending | Asset-based finance | Private equity |
|---|---|---|---|
| Atomic unit | A facility / loan to one borrower | A pool of thousands of underlying assets | An equity stake in a company |
| Primary entity | Borrower (corporate) | Asset pool + servicer + obligors | Portfolio company + cap table |
| What is monitored | Covenants, leverage, coverage | Borrowing base, advance rates, eligibility, delinquency | Ownership %, valuation, board rights |
| Cash flow shape | Scheduled amortization, PIK, floating-rate coupon | Collateral cash flows through a waterfall | Irregular: capital calls, distributions |
| Valuation basis | Mark / impairment (ASC 326) | Pool performance, structural credit enhancement | Fair value (ASC 820), multiples |
| Performance metric | Yield, spread, loss rate | Net yield after losses, advance-rate cushion | IRR, MOIC, DPI, TVPI |
| Granularity | Tens of borrowers | Hundreds of thousands of obligors | Tens of companies |
Two observations follow. First, the granularity gap alone defeats a spreadsheet: a direct lending book tracks tens of borrowers, while a single ABF pool may contain hundreds of thousands of obligors whose delinquency and prepayment behavior drive the position’s value. No grid models both. Second — and this is the key to the solution — beneath the divergence there is a shared skeleton. Every strategy ultimately involves a legal entity, an instrument or position, a stream of cash flows, a valuation at a point in time, and a fund that holds it. The differences are real but they are extensions of a common core, not separate universes. That insight is what makes a unified model possible.
A unified data model does not erase the differences between strategies; it factors them. The design pattern is well established in data engineering — a canonical core of shared entities, extended through supertype-subtype (also called generalization-specialization) modeling, so that everything strategies have in common is represented once, and everything specific to a strategy is represented as a typed extension of the common structure.
At the center sits a small set of entities that every strategy shares. These are the load-bearing tables of the entire platform, and getting their definitions right is the single most important act of the design:
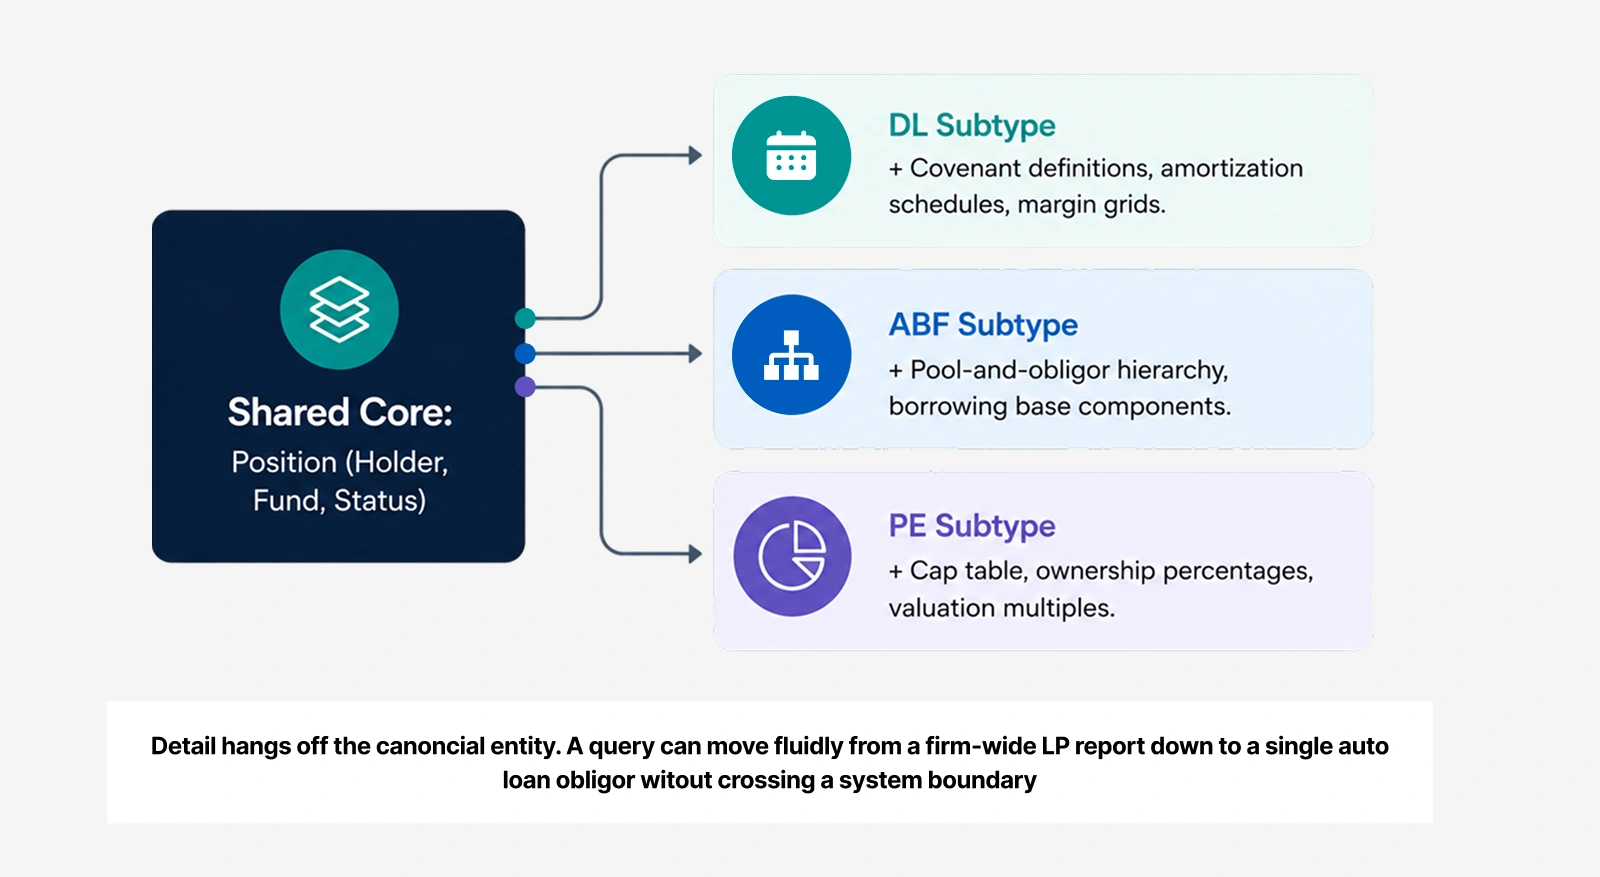
Each strategy then extends the core with its own typed detail, attached to the shared entities rather than living in a separate system. Direct lending adds covenant definitions, amortization schedules, and margin grids to the instrument subtype. ABF adds the pool-and-obligor hierarchy, borrowing-base components, advance rates, and eligibility rules — the one-to-many explosion from a single position to hundreds of thousands of underlying assets handled as a child relationship, not a separate database. Private equity adds the cap table, ownership percentages, and valuation multiples. Because each extension hangs off the same canonical entities, a query can move fluidly from the firm-wide view down to a single obligor in a single pool without crossing a system boundary.
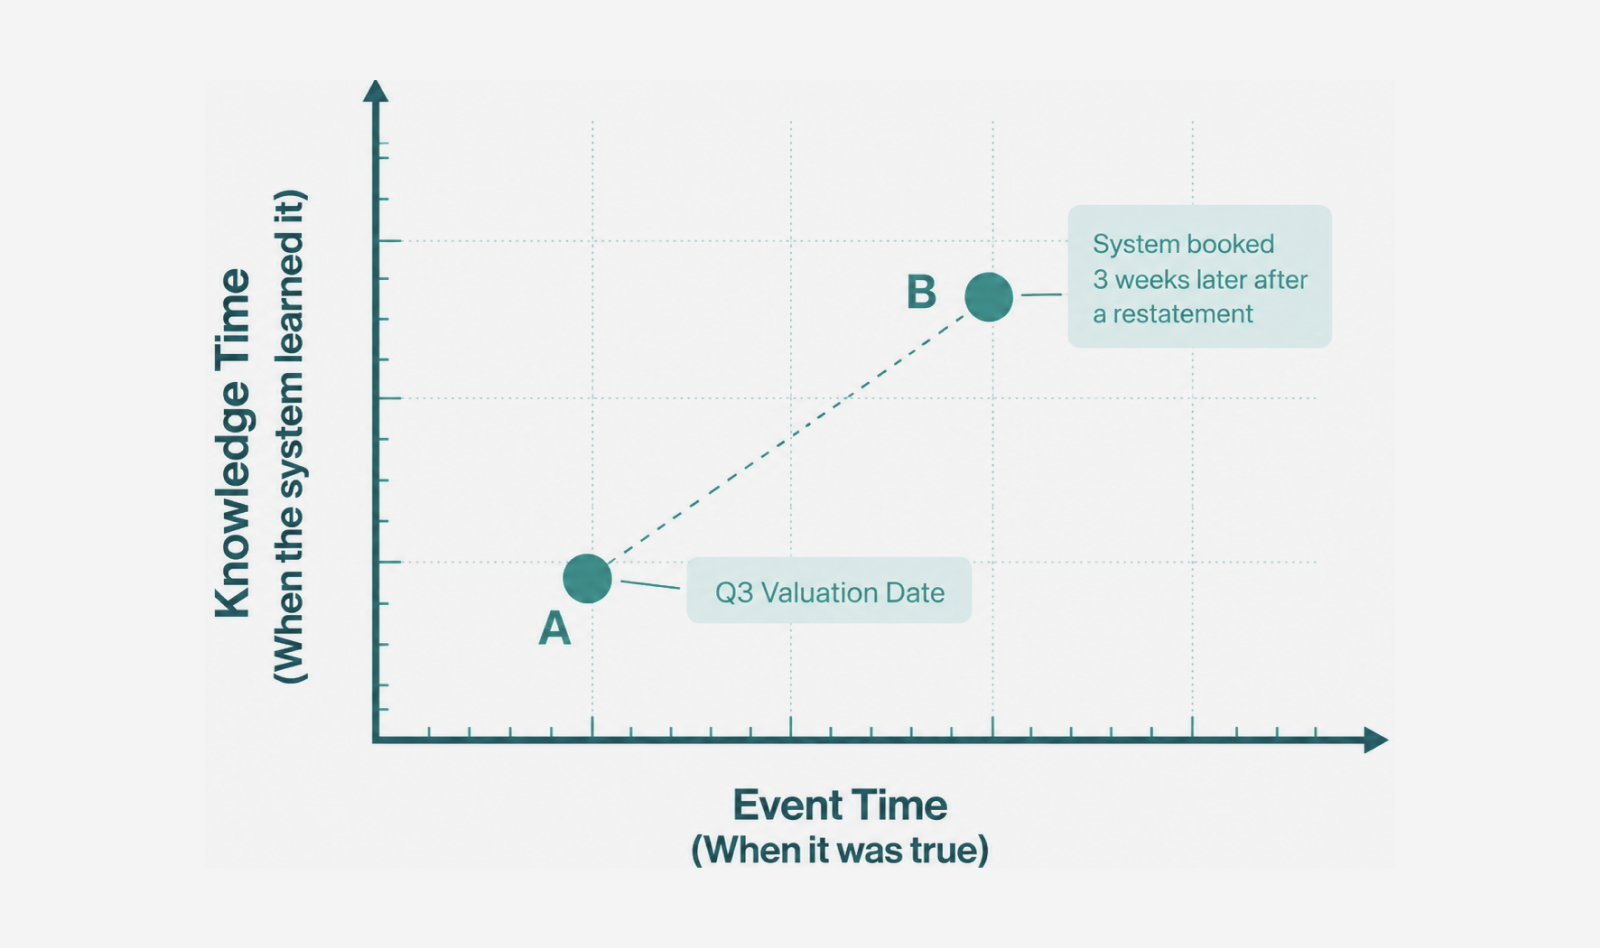
The final architectural requirement is the one spreadsheets handle worst: time. Investment data has two independent time dimensions — when something was true in the world (a valuation as of quarter-end) and when the system learned it (the mark booked three weeks later after a restatement). A bitemporal data model records both, which is what makes it possible to answer “what did we believe our NAV was on the reporting date, given only what we knew then?” — the question every audit, every ASC 820 review, and every regulatory filing ultimately asks. A spreadsheet overwrites; a bitemporal model remembers. This is the difference between data that is merely current and data that is investment-grade.
The architecture below is a target. Reaching it reliably depends on a handful of data-engineering disciplines that distinguish a durable model from one that quietly degrades into a structured version of the spreadsheet mess it replaced.
| Principle | What it means | Why it matters across strategies |
|---|---|---|
| Single master record | One canonical identity per entity, instrument, and position. | The only way to see one borrower across a loan and a collateral pool simultaneously. |
| Separate data from logic | Store facts; compute metrics in a defined, versioned layer. | Covenant, advance-rate, and IRR logic differ by strategy but read from one fact base. |
| Supertype-subtype modeling | Common attributes once; strategy detail as typed extensions. | Represents three instrument shapes without three databases. |
| Referential integrity | Enforced relationships; no orphaned or contradictory records. | A pool cannot exist without its position; a cash flow cannot float free of its instrument. |
| Bitemporal history | Record both event time and knowledge time. | Point-in-time NAV and audit defensibility under ASC 820 / 326. |
| Data lineage | Trace every value to its source and transformation. | Investment-grade data for regulators, auditors, and AI alike. |
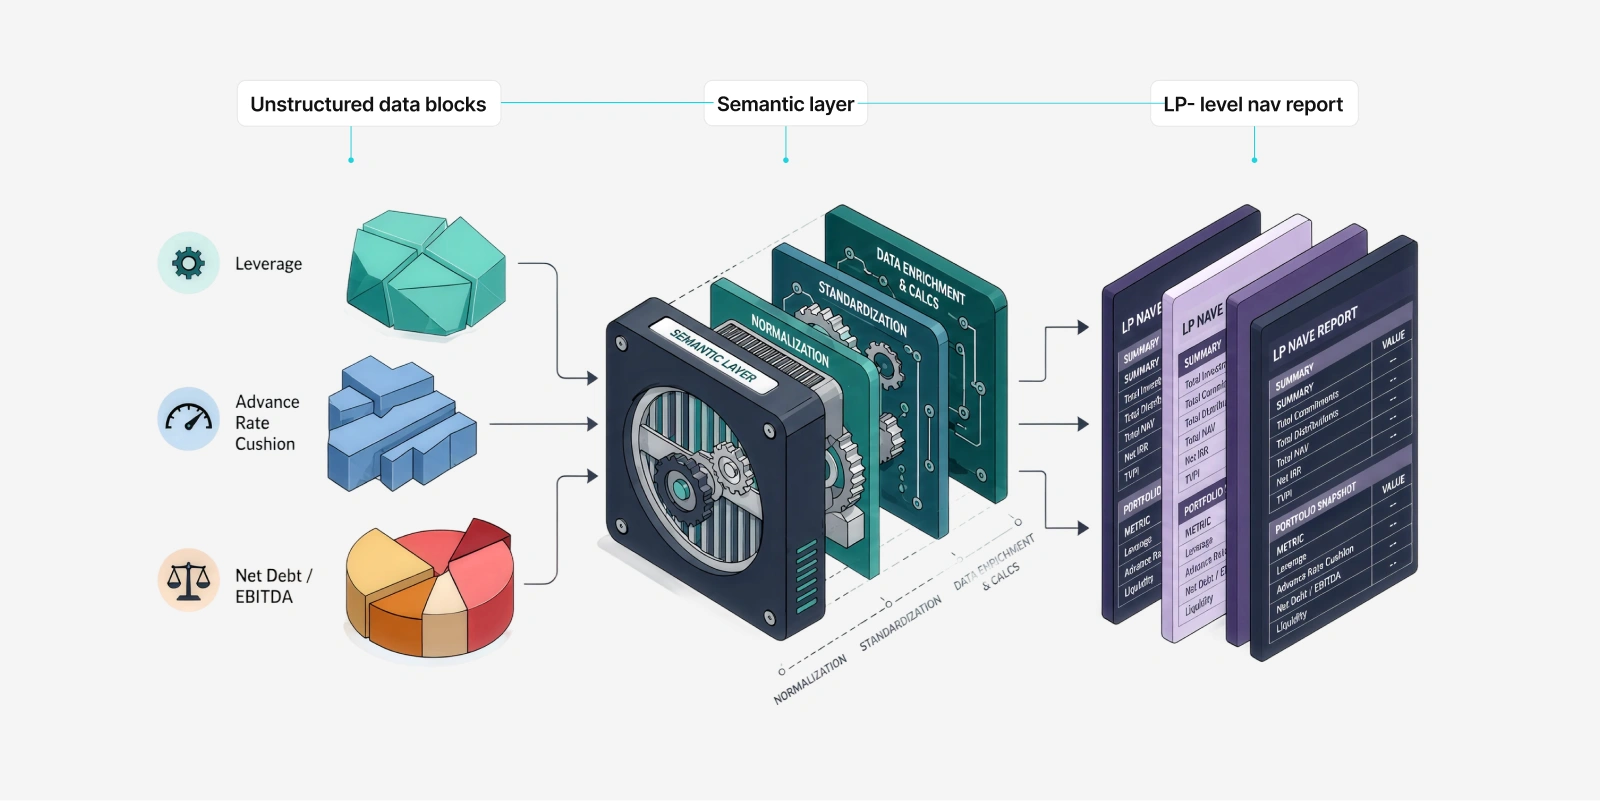
A semantic layer sits above the canonical model to make it usable. This is where strategy-specific vocabulary is reconciled to shared meaning: “leverage” in direct lending, “advance rate cushion” in ABF, and “net debt / EBITDA” at a portfolio company are different computations that a well-designed semantic layer can expose through consistent, governed definitions. The semantic layer is what lets a single LP report draw a coherent NAV from three strategies whose underlying mechanics share nothing — without forcing the analyst to know which strategy each number came from.
The return on a unified data model is not a tidier database; it is a set of capabilities that are simply unavailable when each strategy lives in its own spreadsheet. Each follows directly from the canonical core.

Total borrower exposure resolves to one master entity.

Fund & LP-level NAV becomes a governed query, not a manual reconciliation.

A bitemporal, canonical core is the precondition for defensive AI
When every party resolves to one master legal entity, the platform can answer the question that fragmented data cannot: what is our total exposure to this borrower, across every strategy and every fund? A corporate that appears as a direct loan, as an obligor inside an ABF pool, and as a supplier to a portfolio company is one entity in the model — so concentration that would otherwise hide across three books surfaces in a single query. In a market where the First Brands episode showed the cost of undetected cross-collateral exposure, this is not a reporting nicety; it is risk management.
Because valuation and cash flow are canonical, fund-level and LP-level NAV become a query against governed data rather than a quarter-end reconciliation across spreadsheet estates. A multi-strategy fund that holds direct loans, ABF participations, and equity stakes can produce a single coherent capital account because all three are valued and recorded in the same structure, with the same point-in-time discipline.
Every credit manager now wants AI on its portfolio. But a model trained or prompted on inconsistent, ungoverned spreadsheet data inherits that inconsistency and produces confident, unverifiable output. A unified data model with lineage and bitemporal history is the substrate that makes AI defensible: the model reasons from a single source of truth where every figure traces to its origin and every historical state is preserved. The unified data model is not a competing priority to an AI strategy — it is the precondition for one.
For the operations and technology leaders who own this decision, a unified data model is a multi-year asset, and a few principles separate the builds that endure from those that ossify.
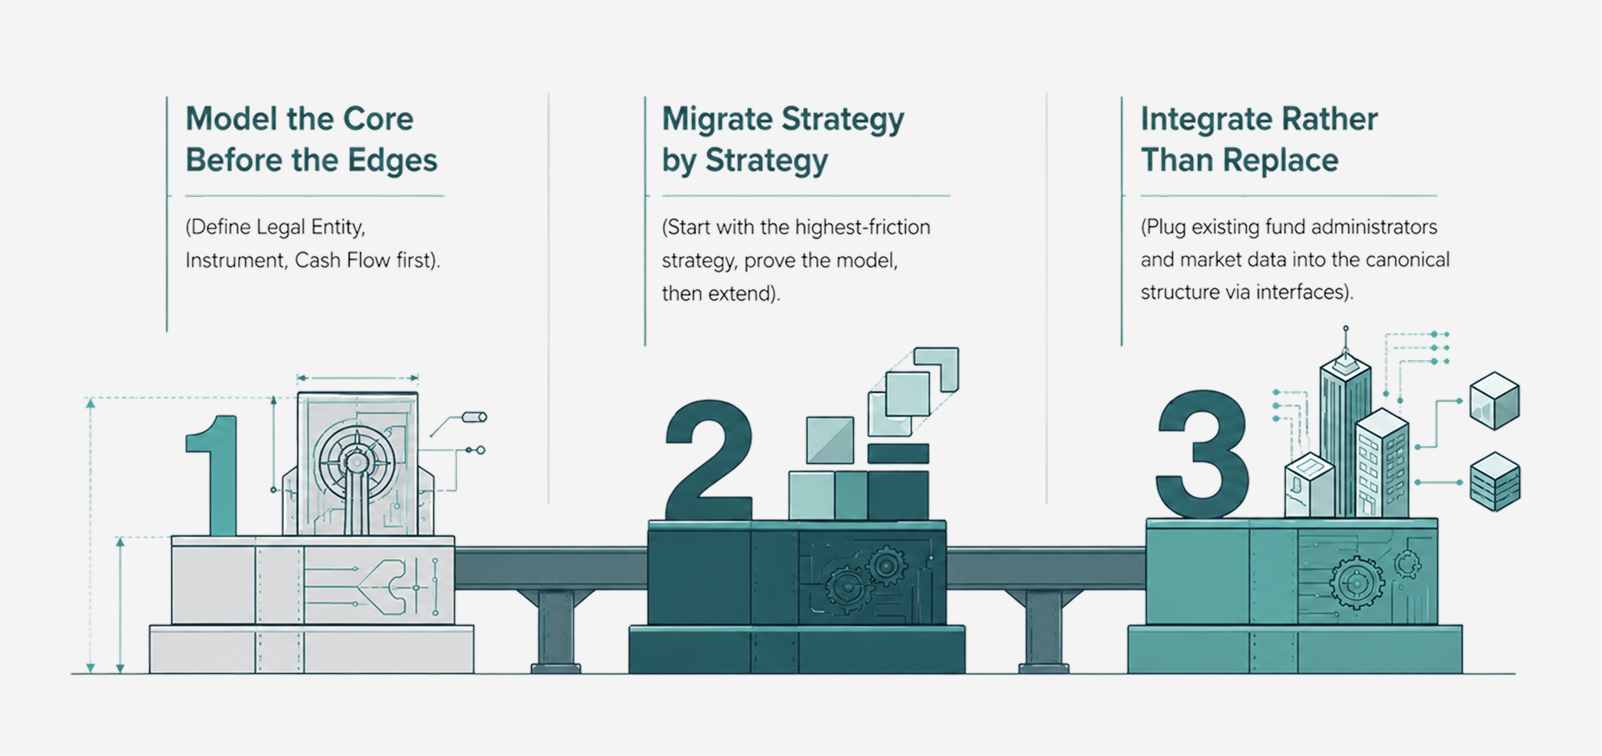
The temptation is to start with the most complex strategy and its richest detail. The discipline is the opposite: define the canonical core — legal entity, instrument, position, cash flow, valuation, fund — and its identity rules first, because every strategy extension depends on them. A core defined loosely will not hold the weight of three strategies; a core defined well will absorb a fourth and fifth strategy without redesign.
A unified model does not require migrating every strategy on day one. The durable pattern is to stand up the canonical core, migrate the highest-friction strategy first — often direct lending, where covenant monitoring is most time-sensitive — prove the model, then extend to ABF and private equity. This sequencing turns a multi-year program into a series of provable milestones, and avoids the enterprise-wide overhaul that so often stalls under its own weight.
The unified model is the canonical layer; it does not require ripping out fund administrators, market data feeds, or document systems. Those remain as sources, connected through interfaces that map their data into the canonical structure. The objective is a single governed model of the truth, not a single application that does everything — a distinction that keeps the build tractable and preserves the infrastructure a firm has already paid for.
Building a unified, multi-strategy data model in-house requires sustained expertise in canonical data modeling, supertype-subtype design, bitemporal history, master-data management, and the domain knowledge to model covenants, borrowing bases, waterfalls, and cap tables correctly — plus the ongoing maintenance as instruments and strategies evolve. The modeling patterns are well understood in data engineering; the private-credit domain knowledge to apply them across direct lending, ABF, and private equity simultaneously is the scarce ingredient. The honest build-versus-buy question is not whether the model can be specified, but whether maintaining a canonical cross-strategy data architecture is a core competency a firm wants to own — or one better sourced from a platform purpose-built around it.
Excel persists in credit for a real reason — its flexibility is unmatched for bespoke instruments — but that same flexibility is why it cannot scale across strategies or survive an audit. As managers converge direct lending, asset-based finance, and private equity onto single platforms, the spreadsheet estate fractures into parallel, irreconcilable worlds, and the firm-level view becomes impossible to assemble. Four priorities should guide any firm building the alternative:
ABF’s march toward $9 trillion and the multi-strategy convergence driving it are not slowing. The firms that build a unified data model now will run every strategy from one source of truth; the firms that defer it will keep paying the spreadsheet tax — in error risk, in reconciliation, and in the cross-strategy concentration they cannot see — at exactly the moment the stakes are rising.
The architecture and modeling disciplines in this paper reflect the state of the field. They are not any single vendor’s product. As it happens, they also describe the principle on which Pepper is built. That principle is a single, unified data model beneath every credit and equity strategy a firm runs. It is not a spreadsheet replacement bolted onto existing tools.
Pepper is designed around the canonical core the research points to. Legal entity, instrument, position, cash flow, and valuation are modeled once. Direct lending, asset-based finance, and private equity attach to that core as typed extensions. A borrower carries one identity whether it appears as a loan, an obligor in a pool, or a portfolio company. Time is bitemporal, so every valuation is point-in-time defensible. Lineage is preserved, so every number traces to its source.
That data layer connects through interfaces to the fund administrators, market data feeds, and document systems a firm already uses. The goal is one governed model of the truth, not one application that does everything. And because the data is unified and governed first, any intelligence layered on top reasons from a foundation it can trust.
We share this thinking openly. The market is better served by leaders who can evaluate any architecture rigorously, including ours.
Pepper is the Operating System for Private Credit — a cloud-native platform purpose-built for alternative asset managers. Pepper unifies the entire fund management lifecycle across direct lending, asset-based finance, and private equity strategies on a single canonical data model, while integrating with the fund administrators, market data providers, and document systems a firm already uses — delivering the data clarity and operational leverage that modern multi-strategy managers require.
onpepper.com
Note: Research and market references are provided for the reader’s further study. Figures are drawn from the cited sources; market projections vary by source and methodology. Readers are encouraged to consult primary sources directly.

Articles
August 20, 2026

Articles
August 20, 2026

Articles
August 10, 2026
Sign up for our newsletter to receive biweekly updates on the world of asset management, delivered straight to your inbox.

By providing your email, you will shortly receive the latest report from Pepper.
In a 45-minute session, we'll walk you through how Pepper handles the workflows your team runs today — deal management, portfolio monitoring, fund operations, or LP reporting. You pick the priority.
Not a sales call. A 30-minute conversation with a Pepper practitioner about where your operation is today, where the pressure points are, and whether a platform approach makes sense for your stage of growth.