


Get our report on investing trends!
By providing your email, you will shortly receive the latest report from Pepper.
An industry perspective for operations, technology, and investment leaders



Every private credit COO is currently hearing the same pitch: AI will cut costs, do more with less, and leave you behind if you wait. Almost nobody is telling them what AI needs underneath it to actually work — or why so many firms that have already bought it are getting almost nothing back.
The number is stark. In Allvue Systems’ 2025 GP Outlook Survey, 82% of private credit firms report they have already adopted AI in some form. 58% of those same firms report only minimal use. That gap — real spend, minimal return — is not a story about weak models or unready teams. It is a story about what the AI was pointed at.
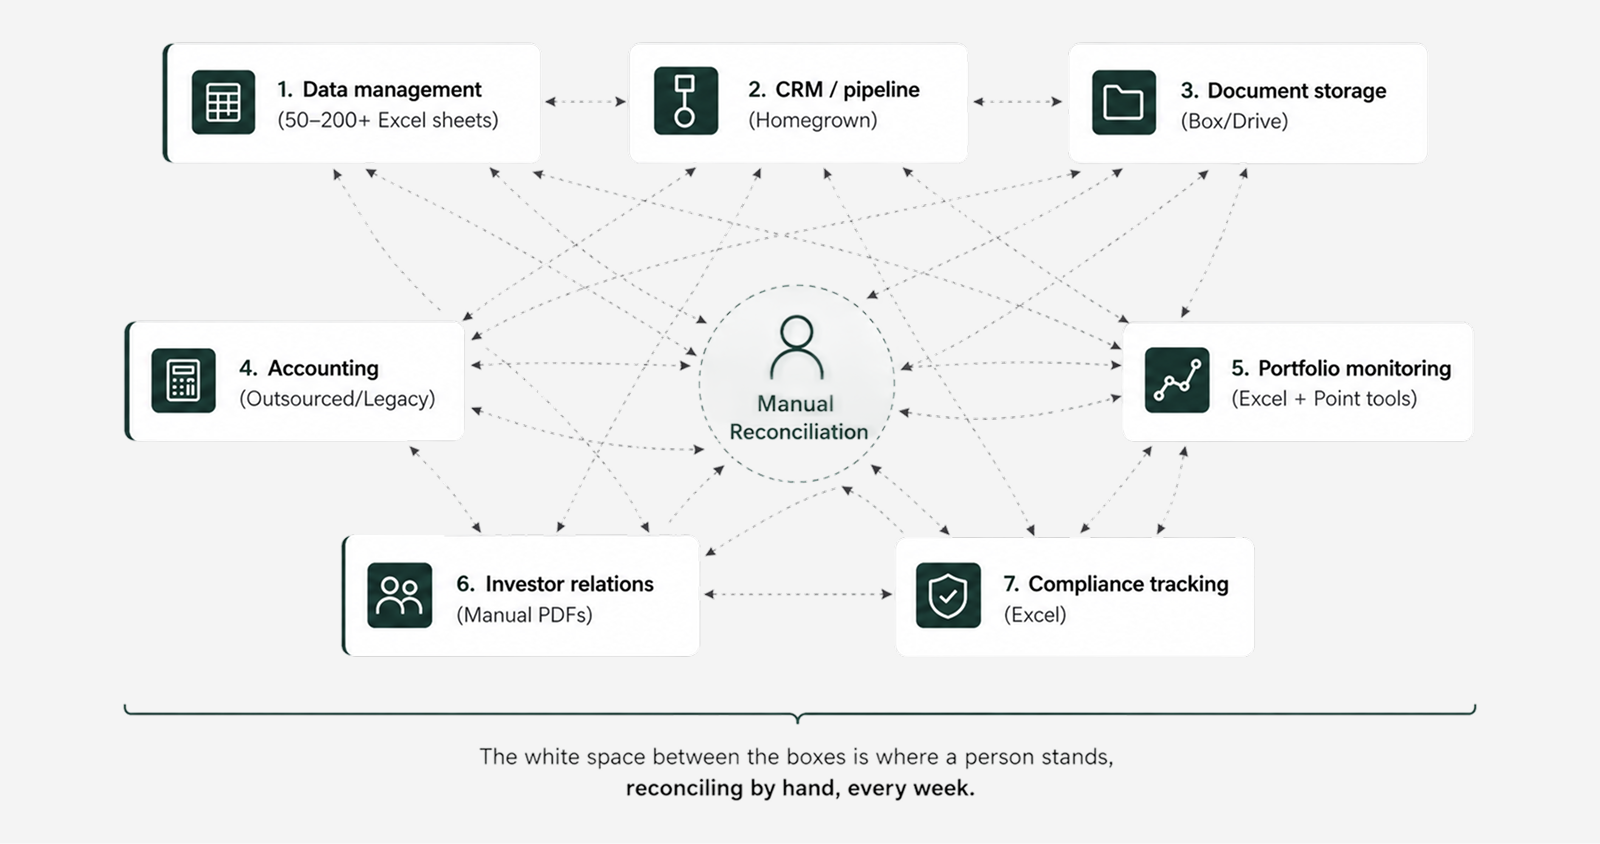
Ask the same COO how many systems their firm actually runs on, and the honest answer is rarely a clean number. It is closer to an estimate — somewhere between fifteen and thirty, depending on how you count the spreadsheets. A CRM for deal pipeline. Excel for portfolio tracking. Box or Dropbox for documents. An outsourced fund administrator with its own portal. A separate compliance tracker. A handful of point solutions nobody remembers procuring. None of these systems were designed with each other in mind, and the work of reconciling their partial, disconnected versions of the truth still falls to a person, doing it by hand, every week.
That fragmentation is not a private credit anomaly — it is the universal condition of the modern enterprise, now arriving in private credit at the worst possible moment: exactly as the industry is being told to move fast on AI. The average organization runs over 100 applications, and only about 28% of them are connected to one another. Gartner puts the price of poor data quality at $12.9 million a year for the average organization. And in a 2025 connectivity benchmark, 95% of IT leaders reported that integration problems are actively impeding their AI initiatives.
This is the mechanism behind the 82%/58% gap. AI has no independent access to the truth; it reasons only from the data it is given. Pointed at a fragmented stack — the same figure sitting in three systems with three update schedules — it does not resolve the inconsistency, it launders it, returning an answer that sounds confident and is not reliable. Pointed at a governed, connected data layer, the same AI becomes a genuine multiplier. The variable that decides which outcome a firm gets is not the model. It is the data underneath it.
This paper does not argue against AI, and it does not offer a shortcut — there isn’t one. It makes a narrower, harder claim: fragmentation is the binding constraint on what AI — or any other investment — can do for a private credit firm at scale, and the order of operations to fix it is not optional. It quantifies the fragmentation problem, maps the typical private credit stack, explains at a technical level why layering AI on top amplifies the problem rather than solving it, defines what a unified data layer actually requires, and consolidates the evidence from five independent research efforts that converge on the same diagnosis from entirely different angles.
Most private credit firms are not failing at AI because of the AI. They are failing because AI is being asked to reason over data that was never unified in the first place — and a model given inconsistent inputs does not flag the inconsistency, it hides it behind a confident-sounding answer.
Fragmentation is not a series of bad decisions — it is the emergent property of many good decisions made without a unifying architecture. The binding constraint on private credit scale, and on every AI initiative built on top of it, is the absence of a single governed data layer beneath the fund lifecycle. The order of operations is not negotiable: unify and govern the data layer first, then layer intelligence on top. Reverse it, and the 58% minimal-use statistic is where a firm ends up.
A natural response to a fragmented stack has been to layer AI on top of it, hoping intelligence at the surface can compensate for disorder underneath. The data on how that has gone is unambiguous — and it points to a sequencing error, not a technology failure. This is the argument the rest of the paper is built to support, so it is worth stating first rather than last.
Allvue Systems’ 2025 GP Outlook Survey found that 82% of surveyed private credit firms have already adopted AI in some form — but 58% reported only minimal use. That gap between adoption and impact is the fragmentation problem wearing a different hat. The general-market data confirms the mechanism is structural: in MuleSoft’s 2025 connectivity benchmark, 95% of IT leaders said integration issues are impeding their AI adoption, and Gartner has projected that through 2026, organizations will abandon 60% of AI projects that lack AI-ready data.
These are three independent measurements of the same wall — capable AI tools cannot produce reliable outputs without clean, connected, governed data beneath them.
| The AI adoption-impact gap | Figure |
|---|---|
| Private credit firms that have adopted AI in some form (Allvue) | 82% |
| Of those, firms reporting only minimal use (Allvue) | 58% |
| IT leaders reporting integration issues impede AI initiatives (MuleSoft) | 95% |
| AI projects Gartner expects abandoned through 2026 for lack of AI-ready data | 60% |
EY’s research on outsourced finance functions makes the mechanism explicit: AI does not work well with bad data. The reason is architectural. A machine-learning model has no independent access to ground truth; it reasons from whatever data it is given. In a fragmented environment, where the same figure exists in three systems with three update schedules, the model cannot know which version is correct — so it produces an output that is internally confident and externally unreliable.
AI does not repair inconsistency; it launders it, converting messy inputs into clean-looking outputs that carry no signal about their own trustworthiness. In an investment context, a confident-but-wrong covenant analysis is worse than no analysis, because it invites action.
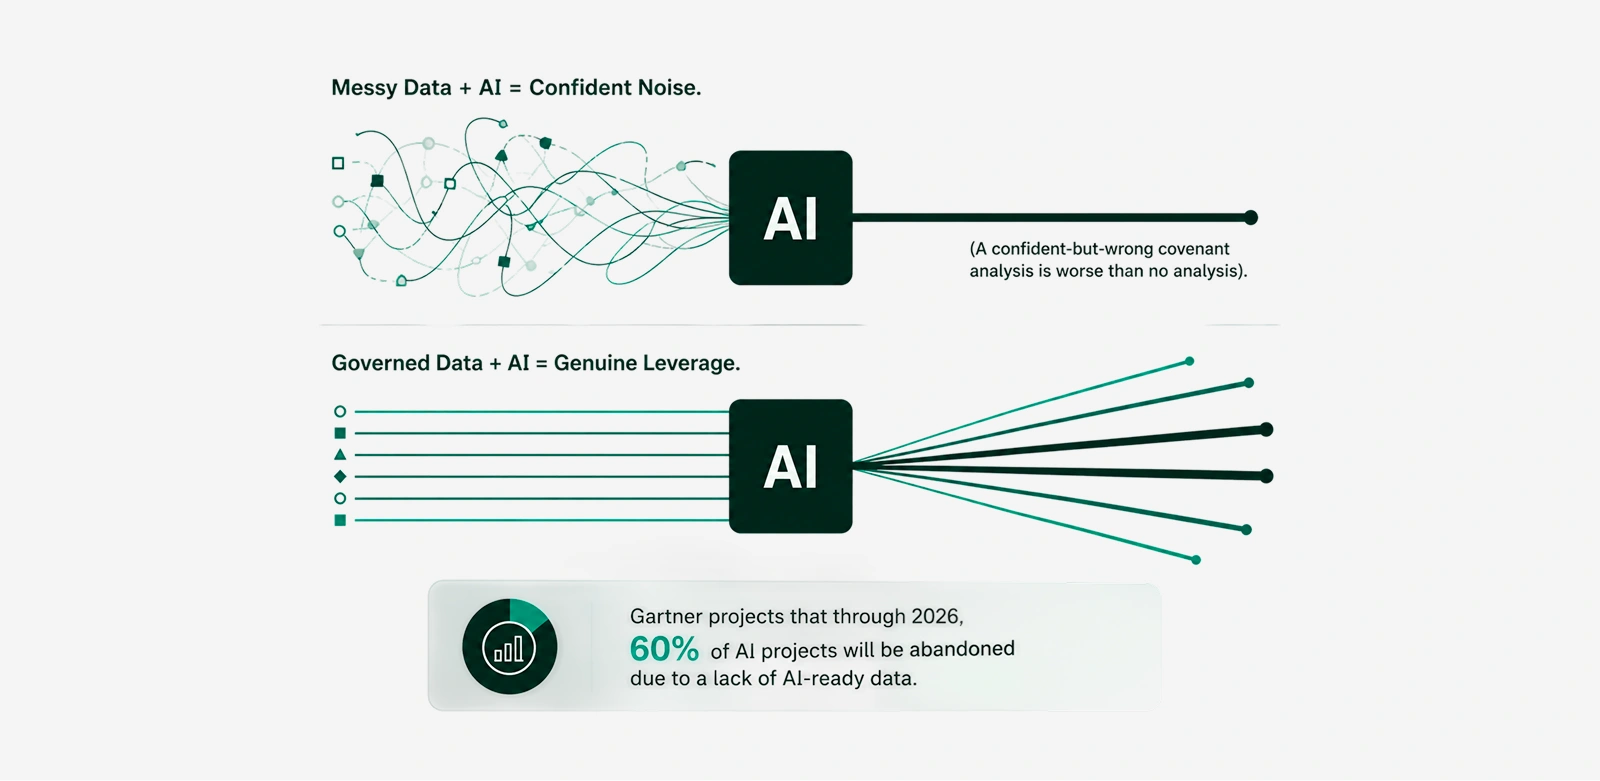
In a governed environment — where data ownership, definitions, and structure are aligned across systems — the same AI becomes a genuine enabler. The variable that flips AI from liability to asset is not the model; it is the data layer beneath it. This is why the order of operations does not fail gracefully when violated. The 60% AI-project-abandonment figure is, in practice, a sequencing failure expressed as a budget loss.
To be concrete about what that implies in practice: AI is genuinely good at reading a document, summarizing a portfolio, drafting a first-pass answer, or flagging an anomaly — provided the numbers it is working from agree with each other. It is not good at deciding which of three conflicting figures is correct, because nothing in a language model’s training tells it that a fund administrator’s number is more authoritative than a CRM’s. That decision requires governance, not intelligence. A smarter model does not solve a governance problem, no matter how the vendor positions it.
This is not a reason to delay an AI plan. It is a reason to sequence it correctly — a distinction the rest of this paper works through in detail.
AI is a multiplier on data architecture, not a substitute for it. On clean, governed, connected data, AI multiplies signal. On fragmented, inconsistent data, it multiplies noise — and dresses that noise in the language of confidence. The Allvue 82%-adopted / 58%-minimal-use gap, the MuleSoft 95%-impeded figure, and Gartner’s 60%-abandonment projection are three views of one wall. Before funding any AI initiative, the diagnostic question is not “which model?” but “is our data layer ready to be amplified?”
Understanding why that wall exists starts with an honest inventory. Application sprawl is now a documented, measurable feature of the enterprise — not a subjective complaint. Understanding its magnitude in the general economy is the necessary backdrop for understanding why it bites hardest in private credit, and why it is precisely what stands between most firms and the AI outcomes they were promised.
| Industry benchmark | Figure |
|---|---|
| Average applications per organization | 6–12 (small/medium) 100+ (large enterprises) |
| Share of enterprise apps actually connected to one another | ~28% |
| IT leaders reporting integration issues impede AI adoption | 95% |
| Finance/operations analyst time spent searching for scattered information | ~2 hrs/day (~1 day/week) |
| Annual cost of poor data quality (average organization) | $12.9 million |
| Data-integration & iPaaS market growth rate | ~13–35% CAGR |
Now narrow to private credit. The asset class is simultaneously the most document-intensive and the fastest-growing segment of alternatives — AUM has grown multifold since 2009 to nearly $3 trillion and is projected to reach $4.5 trillion by 2030. That combination is what makes fragmentation a binding constraint rather than a nuisance: the faster a firm grows, the more systems it accumulates and the heavier the reconciliation tax becomes. The general-economy figure of one full day a week lost to information-hunting is, in a document-heavy private credit operation, an underestimate.
KPMG’s 2025 analysis of the private credit lifecycle names the mechanism directly: rapid growth has produced a proliferation of specialized third-party providers, each excelling within its own slice of the lifecycle but operating in isolation from the rest. And the broader pattern holds — across industries, roughly 30% of SaaS spend is wasted on redundant or unused tools, a tax that compounds with every additional disconnected system.
Map the technology stack at a mid-market private credit firm and a familiar pattern emerges. It is not chaos — every component was a reasonable choice at the time it was made. It is the accumulation of those choices, over several years, into an operating environment nobody designed and nobody fully trusts.
| Function | How it typically runs | The disconnect it creates |
|---|---|---|
| Data management | 50–200+ Excel spreadsheets as the primary repository | No single source of truth; every number exists in multiple versions |
| CRM / deal pipeline | Basic or homegrown, disconnected from portfolio data | Pipeline insight and portfolio performance live in different worlds |
| Document storage | Box, Dropbox, or Google Drive | Finding a specific document consumes hours of someone’s week |
| Accounting / fund admin | Outsourced or legacy infrastructure | Data locked behind a 2–4 week reporting lag |
| Portfolio monitoring | Manual Excel models plus point tools (Carta, CapIQ, PitchBook) | Fragmented; no single view of portfolio health |
| Investor relations | Manual PDF reports, customized per LP by hand | Every report rebuilt from scratch, every cycle |
| Compliance tracking | Excel | High error risk; every audit becomes an ordeal |
None of these choices were wrong in isolation. A CRM was the right call when the firm had eight deals in flight. A second spreadsheet was the right call when a new reporting requirement appeared. Fragmentation is not a failure of judgment; it is what happens when many individually-correct decisions accumulate without a unifying architecture to hold them together. The 28%-connected benchmark from Section 2 is this table viewed from the data layer: each box holds a slice of the truth, and the white space between the boxes is where a person stands, reconciling by hand — and where any AI layered on top has to guess which box is right.
Industry forums are now naming this explicitly as the central operational constraint on the asset class. At the June 2025 Private Credit Technology Summit, convened by DLA Piper and the Private Market Forum, general partners, limited partners, and technology leaders identified interoperability between siloed systems as a defining operational challenge for the next phase of industry growth — alongside the related problem of normalizing unstructured data.
Every connection between two disconnected systems is a reconciliation task. Every reconciliation task is performed manually, on a schedule, by a person comparing one system’s version of a number against another’s. And manual reconciliation, done often enough, produces errors at a rate that compounds with portfolio size. The cost is rarely budgeted, because it is distributed across people whose job descriptions say something other than “reconcile systems.”
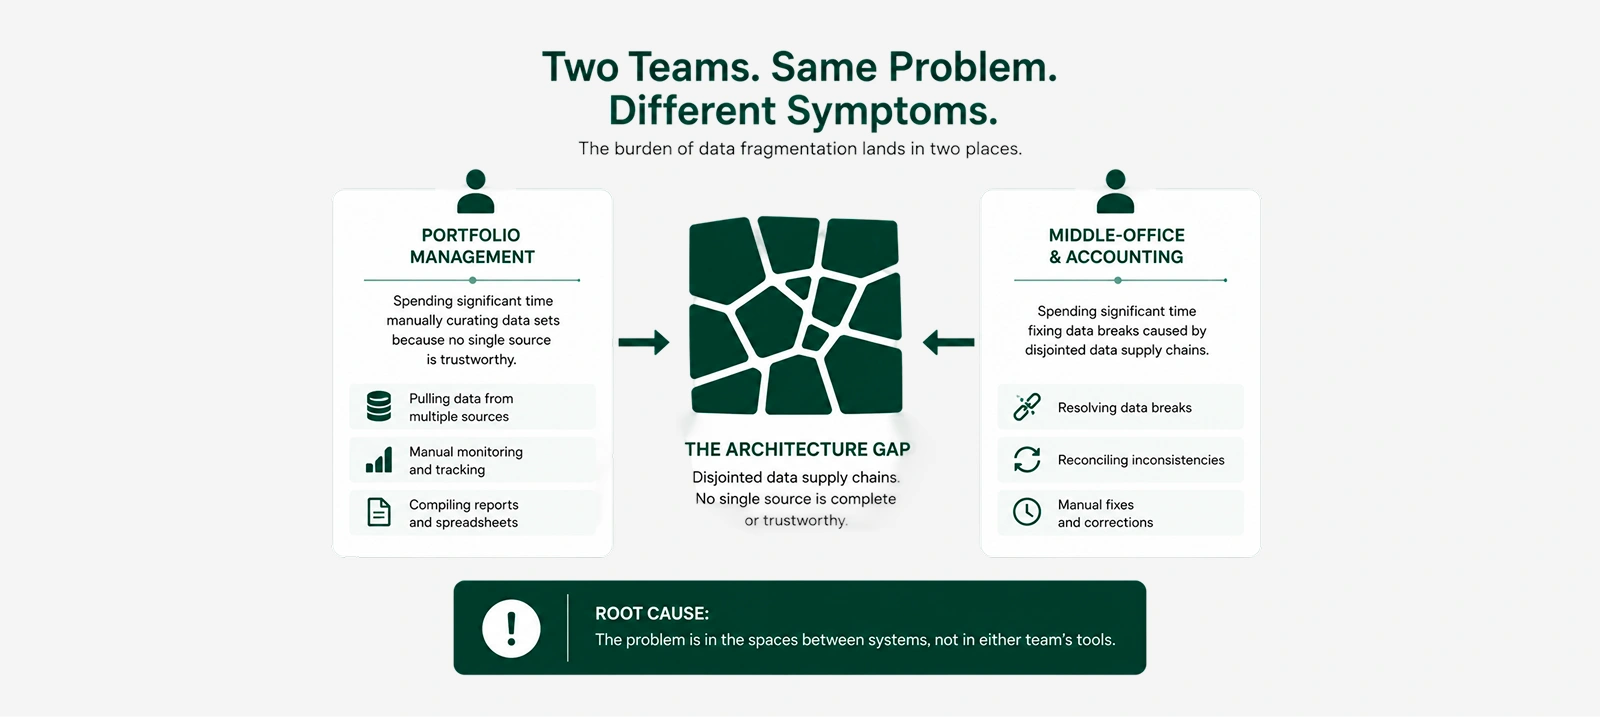
EY’s research into data strategy across the private credit lifecycle identifies precisely where this burden lands. Portfolio management teams spend a significant share of their time manually curating data sets — pulling numbers from multiple sources because no single source is trustworthy on its own. Meanwhile, middle-office and accounting teams spend significant time fixing data breaks caused by disjointed data supply chains feeding in from upstream systems. The two teams are not duplicating effort by choice; they are each independently compensating for the same underlying architecture problem. Neither can fix it, because the problem is not in either of their systems — it is in the spaces between them.
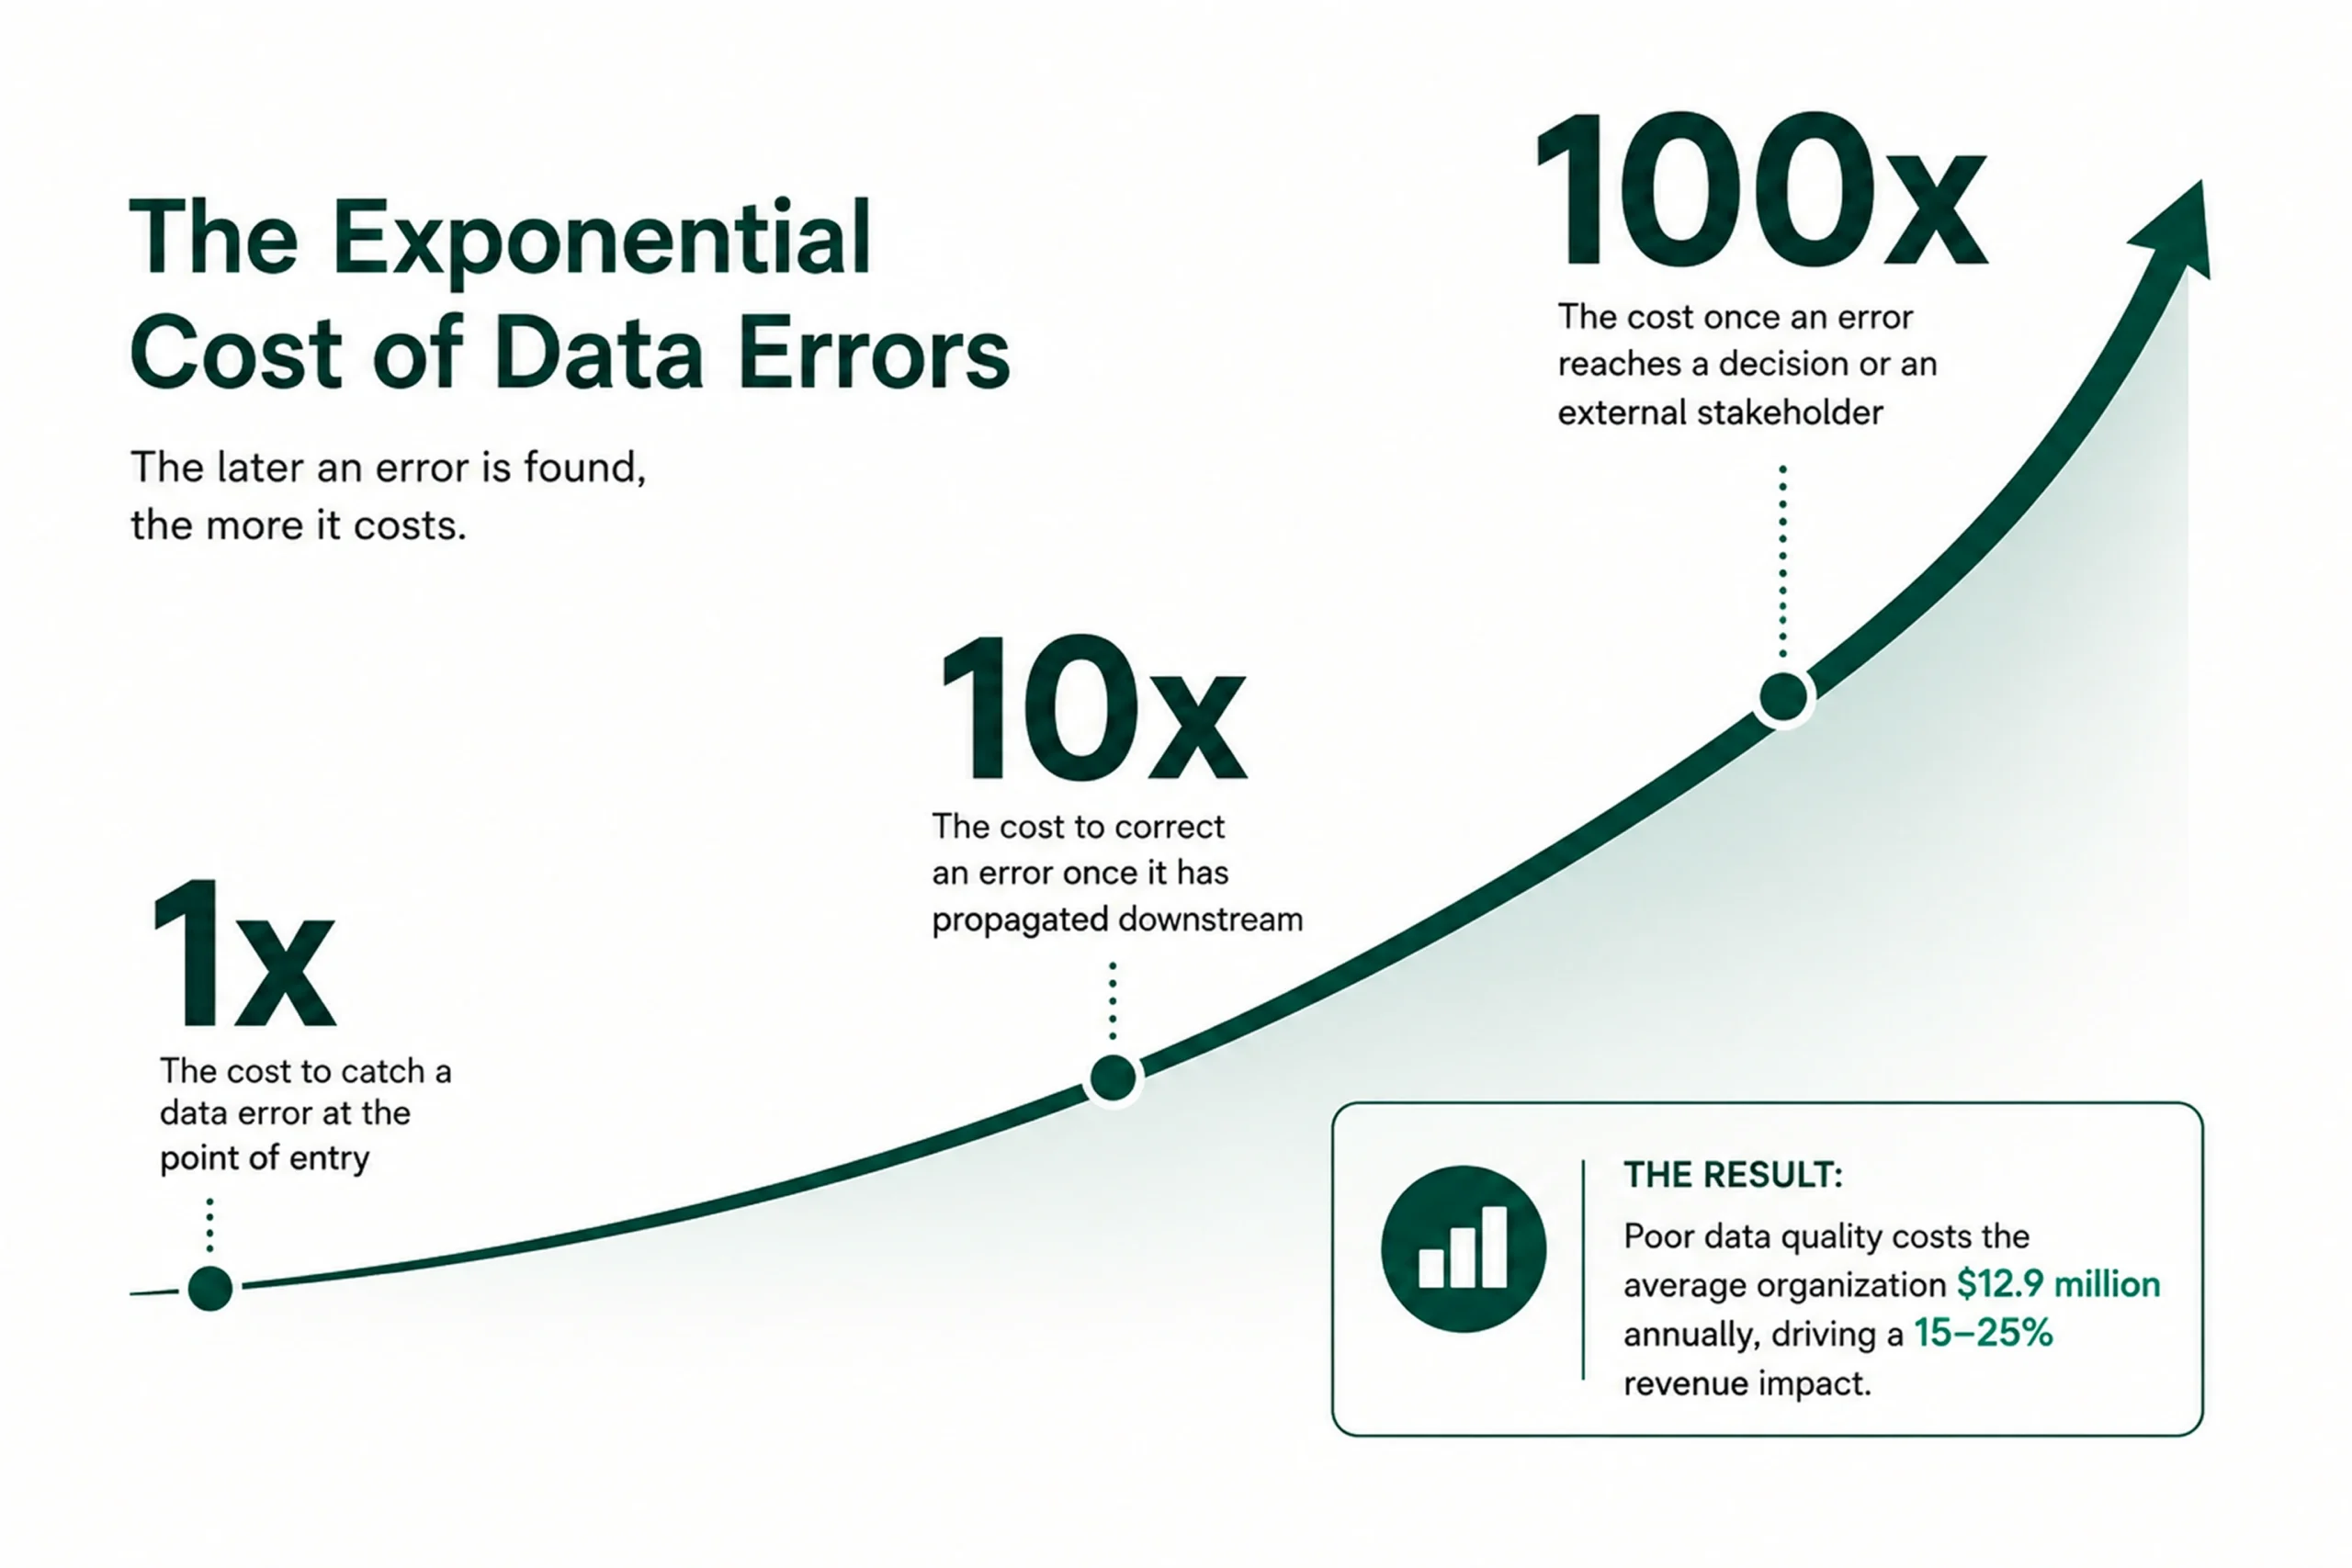
The financial magnitude is documented well beyond private credit. Gartner estimates poor data quality costs the average organization $12.9 million annually; MIT Sloan research puts the revenue impact at 15–25%. The mechanism behind these figures is the 1-10-100 rule, a long-standing principle in quality management: a data error costs roughly 1x to catch at the point of entry, 10x to correct once it has propagated downstream, and 100x once it reaches a decision or an external stakeholder. In a fragmented stack, errors are introduced at every manual handoff and caught — if at all — far downstream, exactly where remediation is most expensive.
| Research finding | Figure |
|---|---|
| Annual cost of poor data quality (avg. organization) | $12.9 million |
| Revenue impact of poor data quality | 15–25% |
| Cost multiplier of an uncaught data error (entry → decision) | 1x → 10x → 100x |
| FS executives delaying tech initiatives over integration | 43% |
| FS executives naming integration complexity as #1 barrier | 54% |
The trigger moment is consistent across firms. A COO says, in some version of these words, “I don’t trust our data.” It usually follows a discrepancy that took half a day to track down, or an LP question that nobody could answer cleanly because the relevant numbers lived in three different systems with three different update schedules.
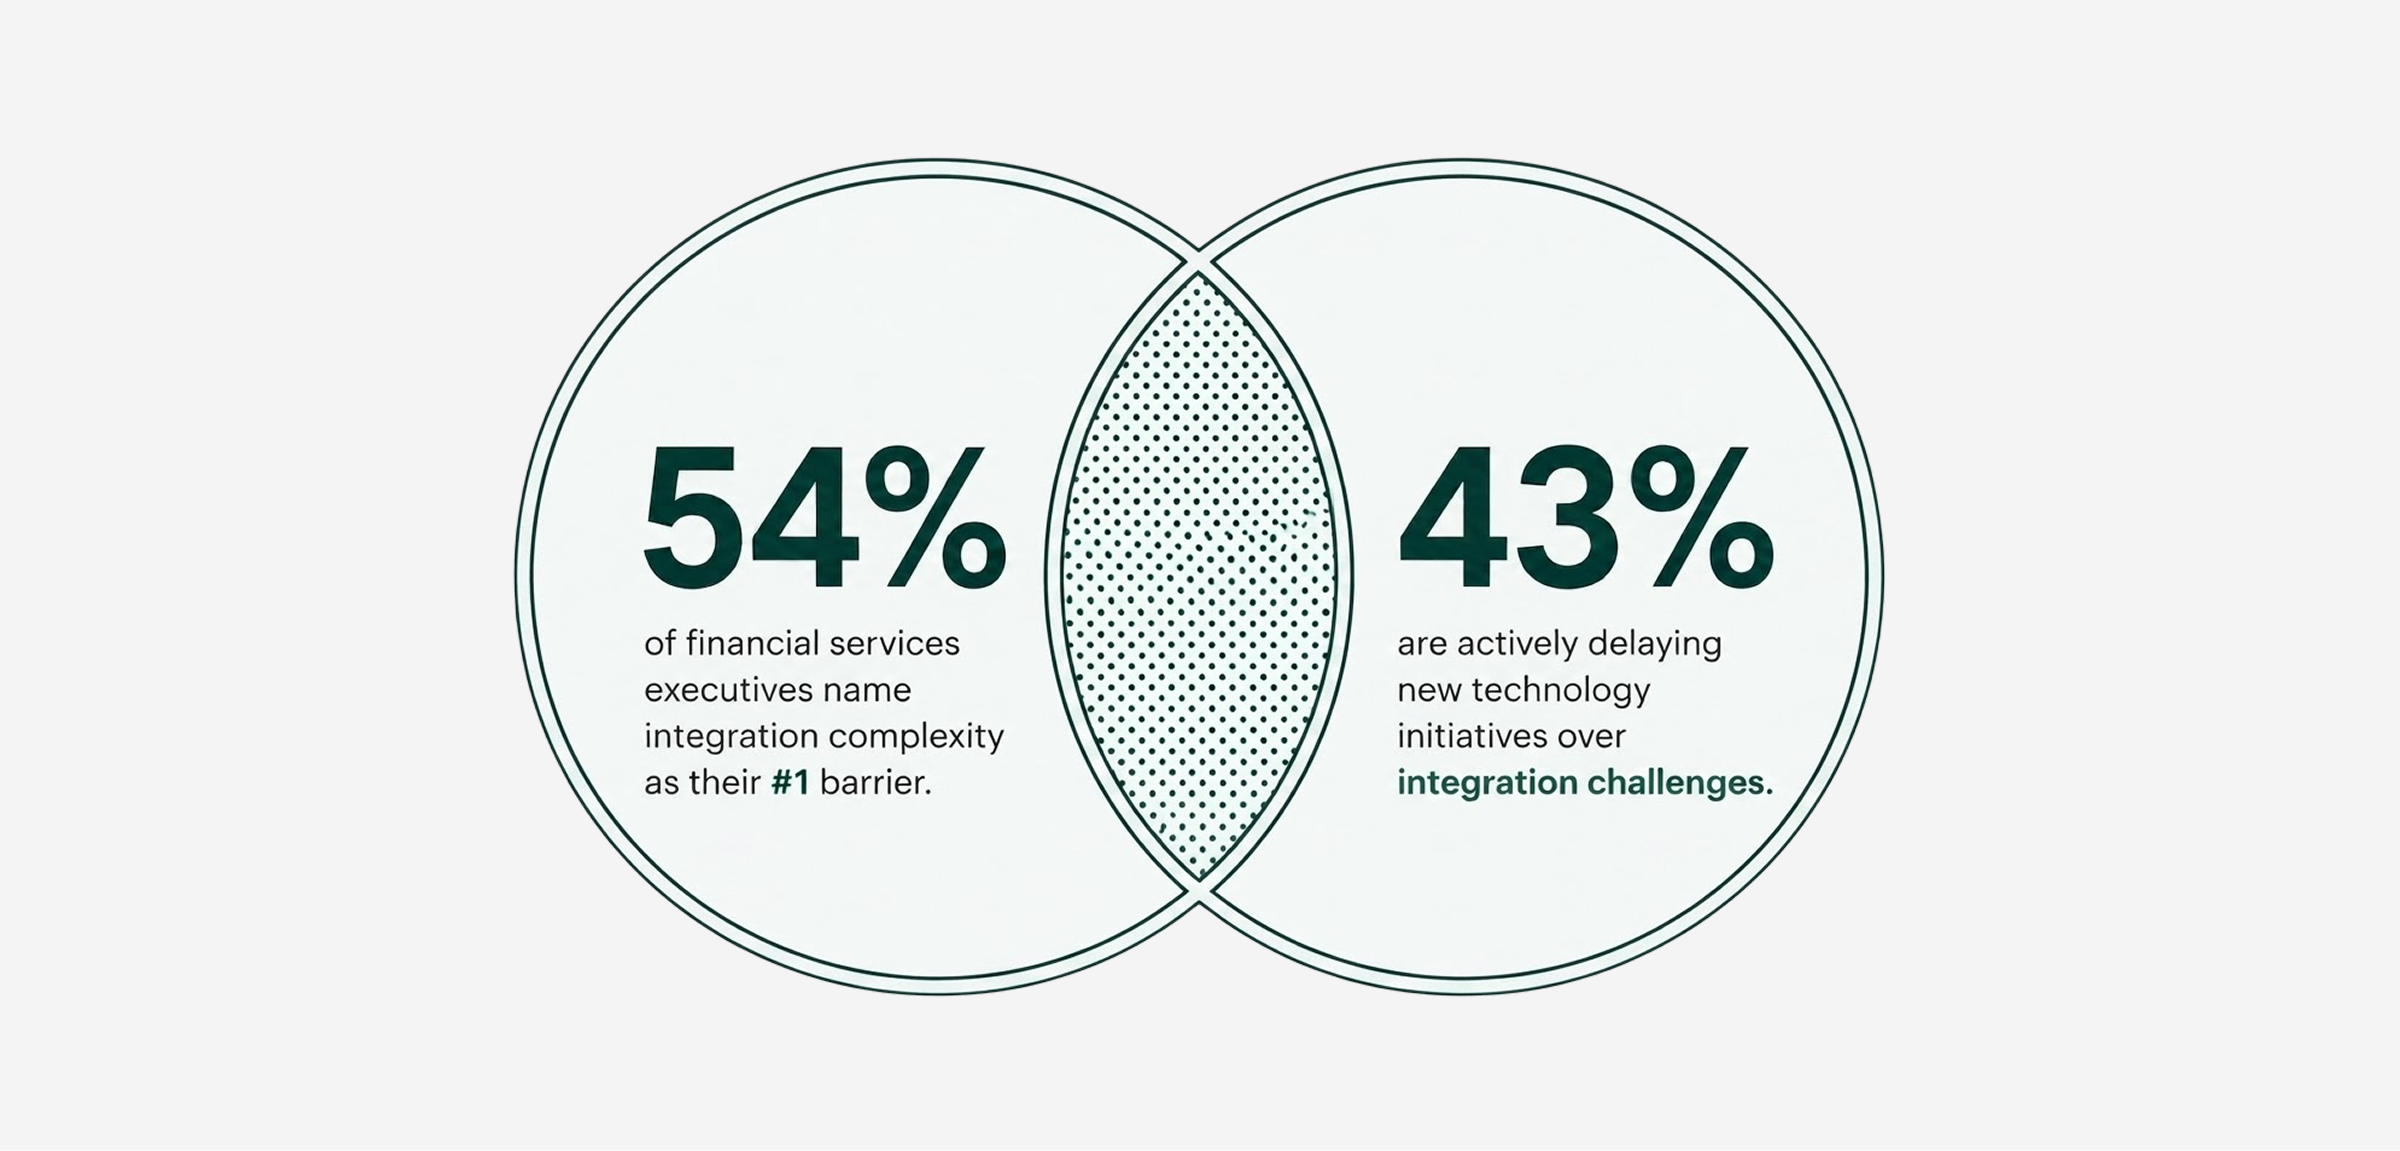
PwC’s 2025 Financial Services Industry Survey surfaces the most counterproductive consequence: with 43% of executives delaying technology initiatives because of integration challenges and 54% citing integration complexity as their primary adoption barrier, fragmentation has become a documented reason firms hesitate to invest in the very technology that would resolve it. The cost of the problem blocks the path to the solution — a trap that compounds every quarter it goes unaddressed.
Front-to-back integration is frequently misunderstood as a single user interface — one screen that replaces fifteen screens. That is not the meaningful definition, and chasing it leads to expensive, multi-year transformation projects that rarely deliver. The data agrees: Allvue’s research into operational scaling found that the most successful automation initiatives are targeted, not enterprise-wide, and that broad transformation programs attempting to fix everything simultaneously routinely stall under their own weight. The definition that matters is more specific and more achievable than a single screen — and it is worth stating plainly, because this is exactly the kind of claim that gets oversold as a buzzword and underdelivered as a project.
The meaningful definition of integration is a single data layer beneath the full fund management value chain: investor onboarding, deal sourcing, investment operations and execution, portfolio monitoring, valuations and performance, exit and distributions. Each stage reads from and writes to the same structured source of truth rather than maintaining its own disconnected copy. The defining technical property is record identity — what data architects call a single master record.
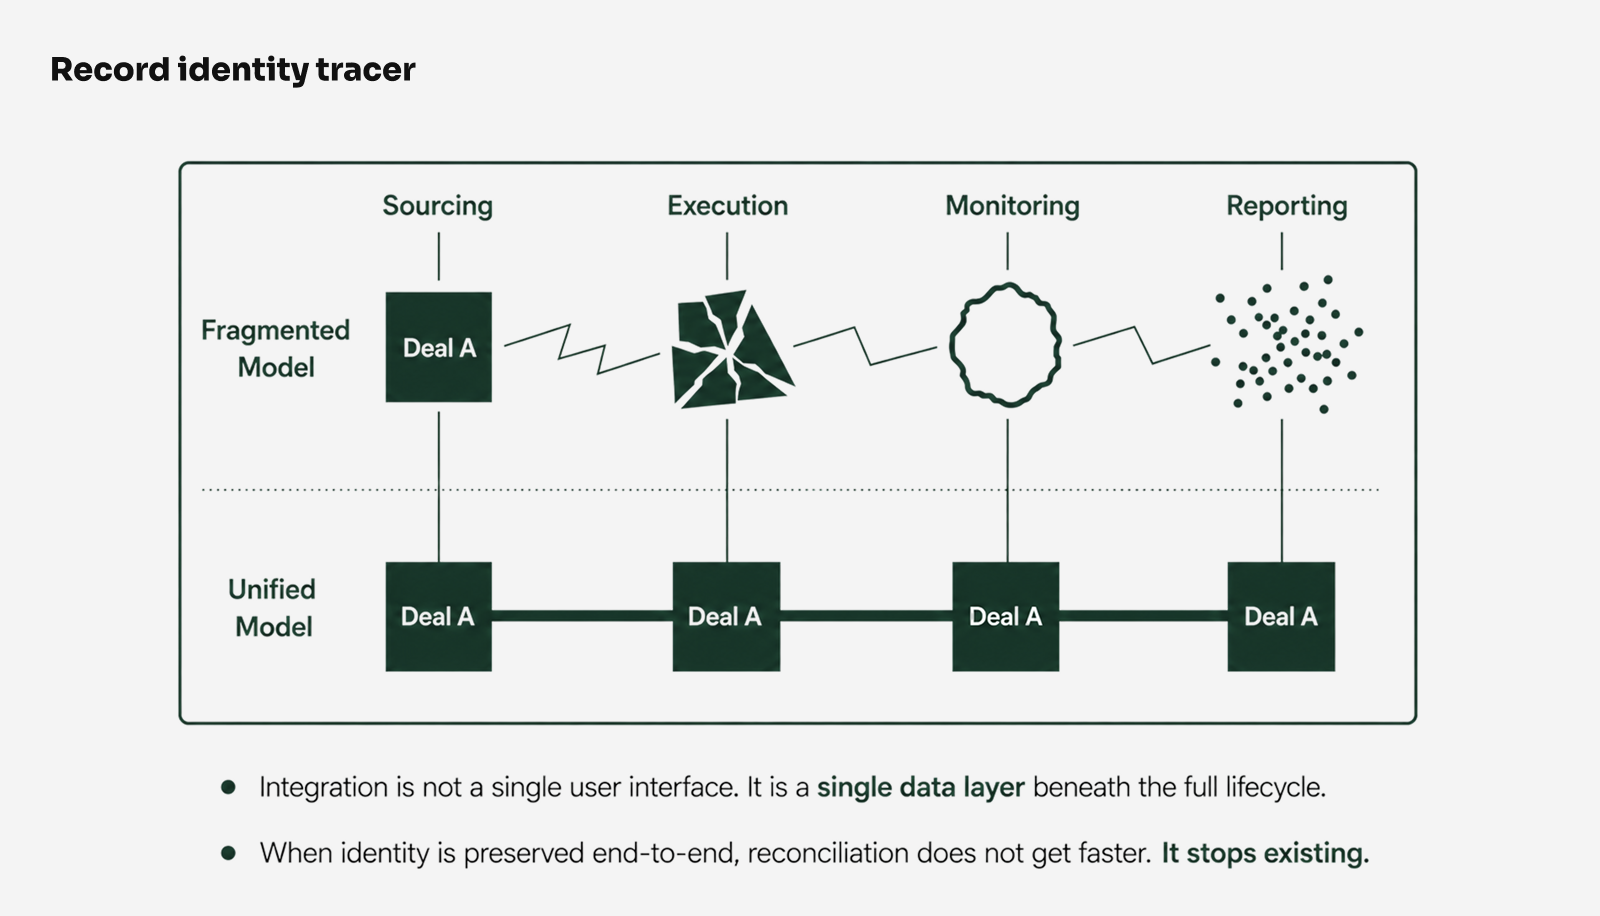
A deal scored during sourcing remains the same deal record through due diligence, the same record in portfolio monitoring, the same record in the LP report. One identity, carried through the entire lifecycle, rather than five reconciled copies living in five systems. When identity is preserved end to end, reconciliation does not get faster; it stops existing, because there is nothing to reconcile — and there is nothing left for an AI model to have to guess between.
Equally important is what a unified data layer does not require: ripping out every existing system on day one. The dominant architectural pattern in modern enterprise integration — reflected in the explosive growth of the iPaaS and API-management markets, expanding 25–35% a year — is API-led connectivity, in which a central data layer connects to existing systems through their interfaces rather than replacing them.
A genuine integration strategy co-exists with the infrastructure a firm has already invested in: fund administrators, prime brokers, market data providers, document systems. The objective is to replace the fragmented middle — the spreadsheets, the manual reconciliation, the disconnected trackers that exist only because nothing else holds the data coherently — not to declare war on every vendor relationship a firm has built. Industry benchmarks find API-led connectivity delivers integration materially faster than custom point-to-point work, which is precisely why the market has consolidated around it.
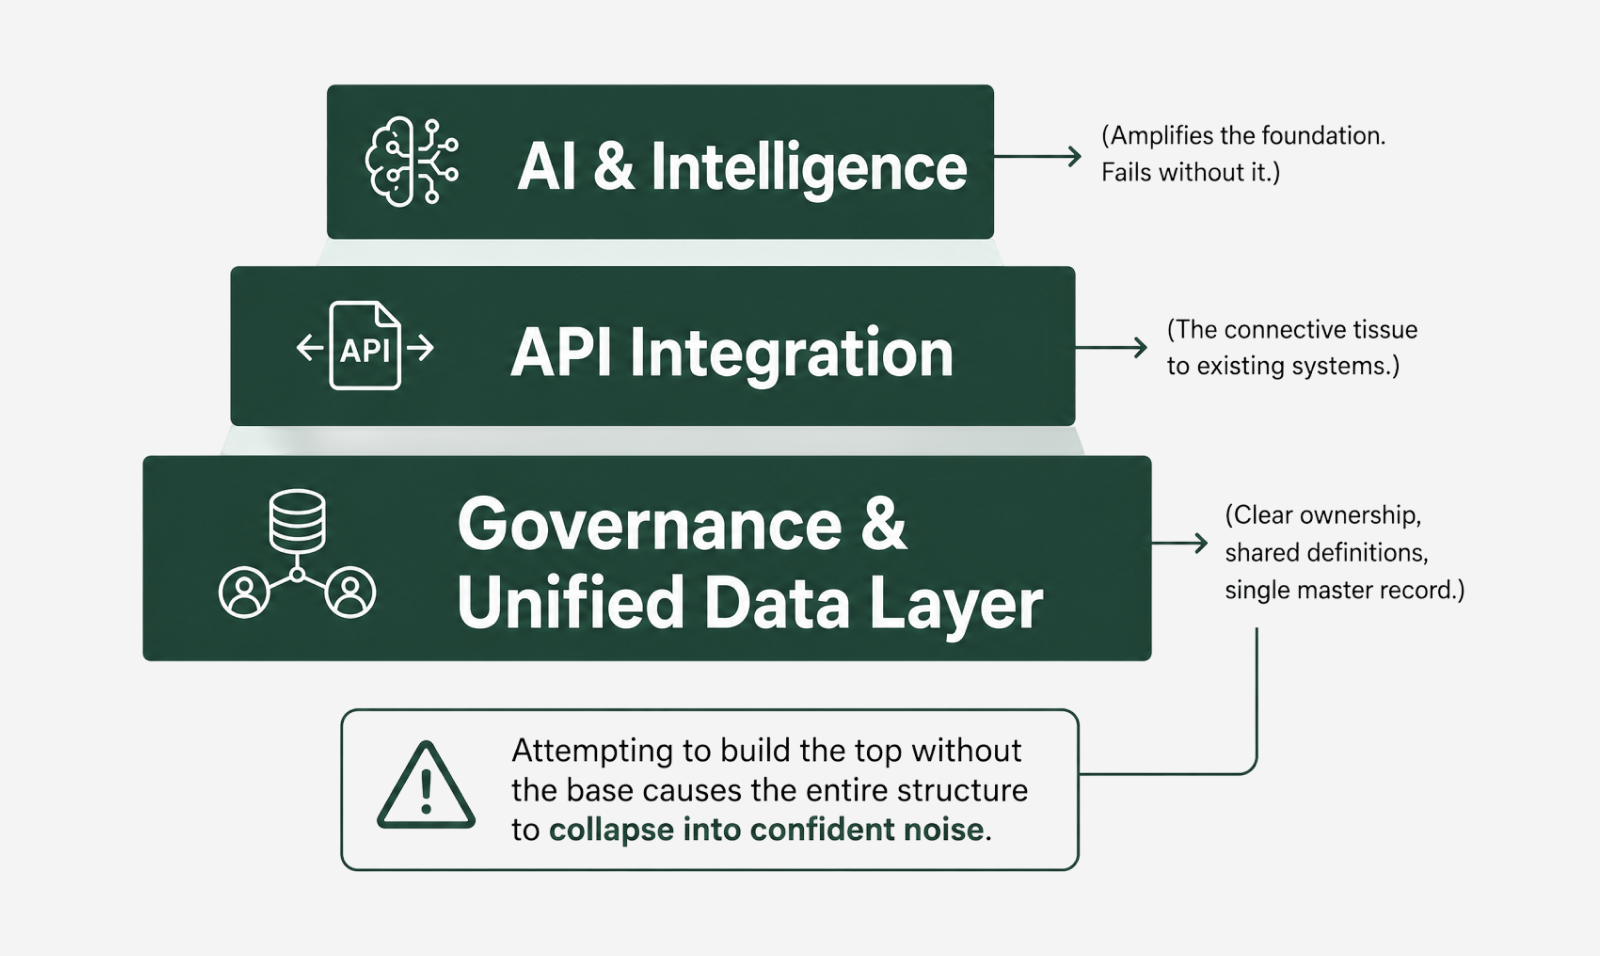
The third requirement is the least visible and the most decisive: data governance — clear ownership, shared definitions, and consistent structure — established before automation is layered on top. This is the same sequencing rule Section 1 established from the AI adoption data, now stated as architecture. Allvue’s 2026 research into operational scaling found that this discipline — clarify ownership and structure, integrate rather than replace, and target high-friction workflows before attempting anything enterprise-wide — is precisely what separates firms that scale successfully from those whose technology initiatives stall. The differentiator is not the size of the ambition; it is the deliberate alignment of data, workflows, and ownership.
| Misconception | Reality | Evidence / Pattern |
|---|---|---|
| Integration means one screen replacing fifteen | Integration means one data layer beneath the lifecycle | Allvue: enterprise-wide overhauls routinely stall |
| You must rip out existing systems | API-led connectivity layers over what you already run | iPaaS / API-management markets growing 25–35% a year |
| Bigger transformation = better outcome | Targeted, high-friction workflows deliver; broad programs stall | Allvue 2026 operational scaling research |
| Add AI to get value from the stack | Unify and govern data first; AI amplifies whatever sits beneath it | MuleSoft 95% impeded; Gartner 60% AI abandonment |
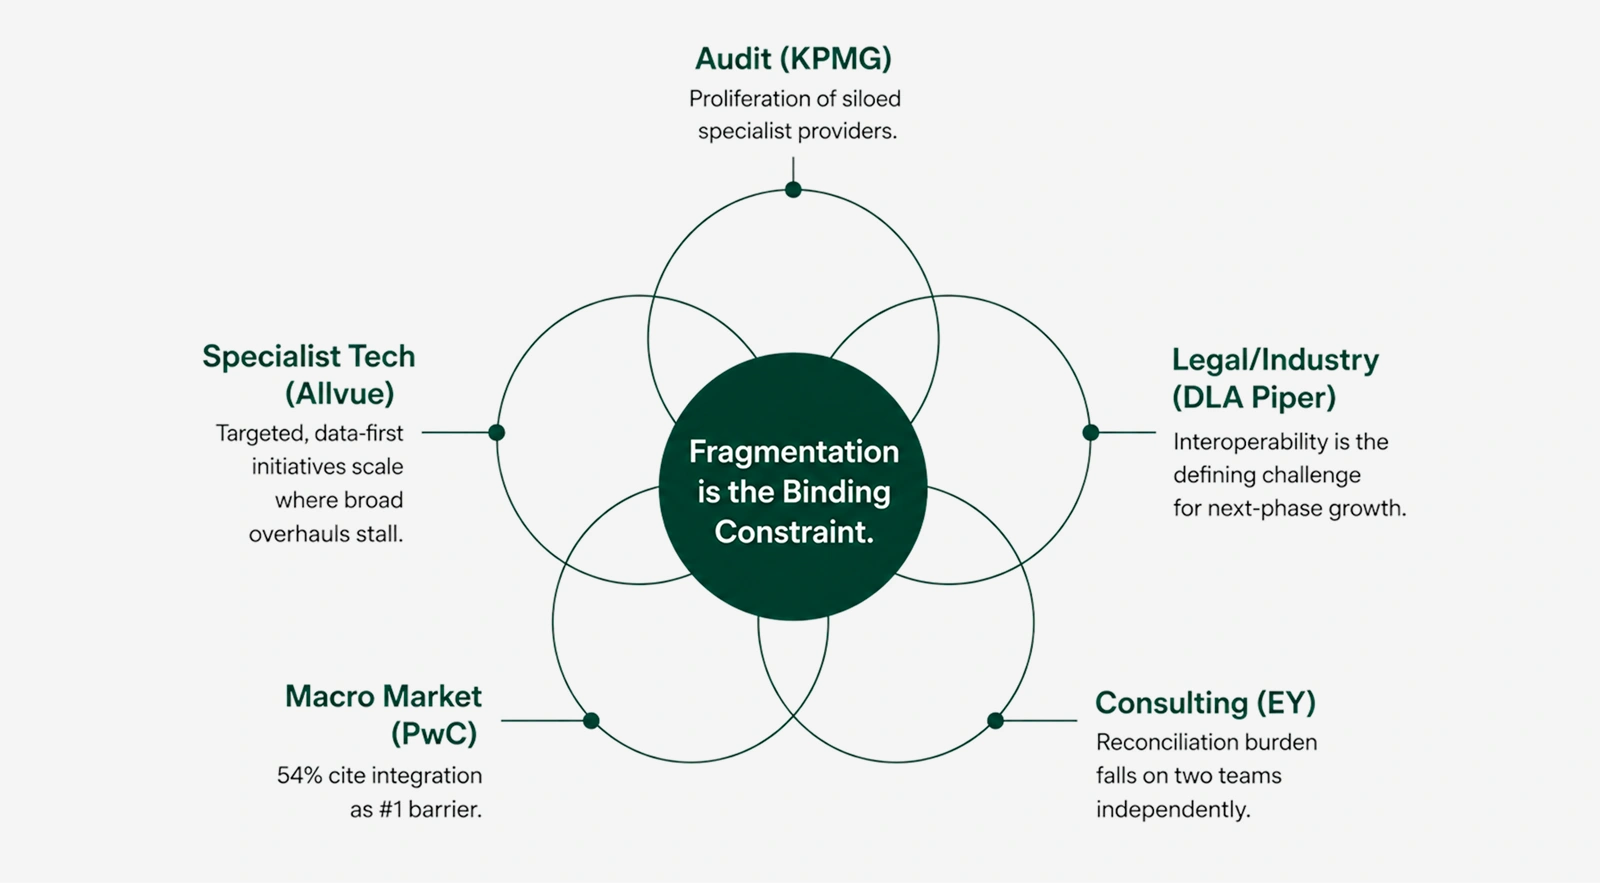
The strongest argument for treating fragmentation as the binding constraint is not any single statistic — it is the convergence. Five independent research efforts, spanning a Big Four audit firm, a global consultancy, a law-firm-convened industry summit, and specialist private credit technology research, arrive at the same underlying diagnosis from entirely different angles — and the general-market benchmarks in this paper (Okta, MuleSoft, Gartner, McKinsey, MIT Sloan) corroborate each of their conclusions from outside the asset class.
| Angle of approach | Conclusion reached |
|---|---|
| Audit / technology lifecycle analysis | Rapid growth has produced a proliferation of siloed specialist providers that do not interoperate. |
| Industry summit — GPs, LPs, technologists | Interoperability between siloed systems is a defining operational challenge for the next phase of growth. |
| Financial services executive survey | 43% have delayed tech initiatives over integration; 54% cite integration complexity as the #1 barrier. |
| Data strategy consulting | The reconciliation burden lands on two teams independently; AI does not work well on fragmented data. |
| Specialist private credit technology research | 82% adopted AI but 58% see minimal use; targeted, data-first initiatives scale where broad overhauls stall. |
The consistency across these sources matters. This is not a single vendor’s diagnosis of a problem that happens to match the solution it sells. It is the consensus reading of a structural issue from auditors, lawyers, consultants, and technologists who arrived at the same conclusion independently — and it is reinforced by hard cross-industry benchmarks on application sprawl, connectivity rates, and the documented failure of AI initiatives built on ungoverned data.
That convergence is the strongest evidence available that the problem is real, the diagnosis is correct, and the constraint is structural rather than incidental.
For COOs and CTOs, the practical path begins with diagnosis, not procurement. Three considerations follow directly from the data in this paper.
Before adding the next fund, the next billion in AUM, or the next AI tool, map every system on a whiteboard and ask a direct question: if an LP doing operational due diligence saw this map, would we be comfortable? Then make it quantitative. The cross-industry benchmark is that only ~28% of enterprise applications are connected; count your own. Every manual handoff between two boxes is a reconciliation task and a 1-10-100 error opportunity. Your connectivity rate is a more honest measure of operational risk than any feature comparison, and it is the metric that should anchor the technology conversation — architecture, not features.
Because AI amplifies whatever sits beneath it, the order of investment matters as much as the investments themselves. Clarify data ownership, definitions, and structure across systems before automating on top of them. A firm that layers AI onto a fragmented stack will spend on intelligence and harvest noise — the documented experience of the 58% who adopted AI and saw minimal use, and the 60% of AI projects Gartner expects to be abandoned for lack of AI-ready data. A firm that unifies and governs the data layer first turns the same AI spend into genuine leverage.
The research is consistent that broad, enterprise-wide transformation programs stall while targeted initiatives against high-friction workflows deliver. Begin where the reconciliation tax is heaviest — typically data extraction, portfolio monitoring, or LP reporting — and integrate rather than replace, connecting to existing fund administrators and data providers through APIs. The goal is to replace the fragmented middle, not to declare war on every vendor relationship the firm has built. Scope discipline is not a compromise; it is the documented difference between initiatives that scale and initiatives that stall.
Assembling a unified data layer in-house requires sustained expertise in data architecture, master-record and entity-identity management across the fund lifecycle, API integration across heterogeneous third-party systems, and data governance — plus ongoing maintenance as counterparties and reporting requirements evolve. The market is voting clearly on this: the iPaaS and data-integration sectors are growing 13–35% a year precisely because firms are choosing to buy the connective tissue rather than build it. The scarce ingredient is not the technology but the architectural discipline to align data, workflows, and ownership across the entire lifecycle — the exact discipline whose absence the five independent studies identify as the binding constraint. The honest build-versus-buy question is whether maintaining a coherent data architecture is a core competency a firm wants to own.
The diagnosis is not contested. Fragmentation — not any single missing capability, and not the choice of AI model — is the binding constraint on private credit scale, and the resolution is a sequencing discipline as much as a technology choice. Four priorities should guide any firm acting on it:
The timing is what makes this urgent rather than merely important. With private credit AUM on track to roughly double to $4.5 trillion by 2030, the manual model converts growth into proportional cost — and every AI dollar spent on top of it converts into the same 58%-minimal-use outcome the industry’s own data already describes. The firms that solve fragmentation first will get the AI outcomes they were promised. Those that defer it will find, as one manager did, that the foundation has to be fixed before the next fund — or the next AI initiative — can launch. The question is not whether to address it, but whether to do so before that moment arrives, or after it has become the reason things are harder than they should be.
The architecture, benchmarks, and sequencing discipline in this paper reflect the state of the field. They are not any single vendor’s product. As it happens, they also describe the principle on which Pepper is built. That principle is a single, unified data infrastructure beneath the entire fund management lifecycle. It spans deal sourcing, execution, portfolio monitoring, fund operations, and investor reporting. It is not another point solution added to the stack, and it is not an AI feature bolted onto a fragmented one.
Pepper is designed around the one thing the research identifies as decisive. Every stage of the lifecycle reads from and writes to the same governed source of truth. A deal record carries a single identity from sourcing through to the LP report. It does not exist as five reconciled copies in five systems.
That data layer connects through APIs to the systems a firm already uses. It works with the fund administrators, prime brokers, and data providers already in place. The goal is to replace the fragmented middle, not the infrastructure a firm has invested in. And because the data is unified and governed first, any intelligence layered on top — Pepper’s own or otherwise — operates on a foundation it can trust. It amplifies signal, not inconsistency.
Pepper is the Operating System for Private Credit — a cloud-native platform purpose-built for alternative asset managers. Pepper unifies the entire fund management lifecycle — deal sourcing, execution, portfolio monitoring, fund operations, investor reporting — on a single data layer, while integrating with the fund administrators, prime brokers, and data providers a firm already uses, delivering the data clarity and operational leverage that modern private credit managers require.
onpepper.com
Note: Research and market references are provided for the reader’s further study. Figures are drawn from the cited sources; market projections vary by source and methodology. Readers are encouraged to consult primary sources directly.

Articles
August 20, 2026

Articles
August 20, 2026

Articles
August 10, 2026
Sign up for our newsletter to receive biweekly updates on the world of asset management, delivered straight to your inbox.

By providing your email, you will shortly receive the latest report from Pepper.
In a 45-minute session, we'll walk you through how Pepper handles the workflows your team runs today — deal management, portfolio monitoring, fund operations, or LP reporting. You pick the priority.
Not a sales call. A 30-minute conversation with a Pepper practitioner about where your operation is today, where the pressure points are, and whether a platform approach makes sense for your stage of growth.